Crypto Academy / Season 4 / Week 1 - Homework Post for Prof. @allbert - Trading with Strong, Weak and Gap Levels

However, once there is familiarity with these concepts, it becomes very easy to find our ways through the stormy seas of blockchain dynamics and transactions. Thus, I am quite excited about the prospects this lesson hold. Accordingly, I will attempt to demonstrate my comprehension of the lesson by giving answers to the questions below.

Graphically, Explain the Difference Between Weak and Strong Levels. (Screenshots Required) Explain What Happens in the Market for these Differences to Occur.
Weak Levels
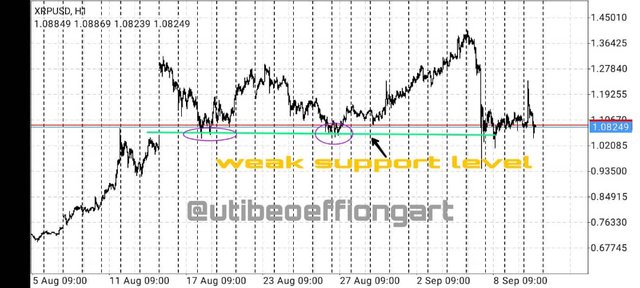
Weak Support Level
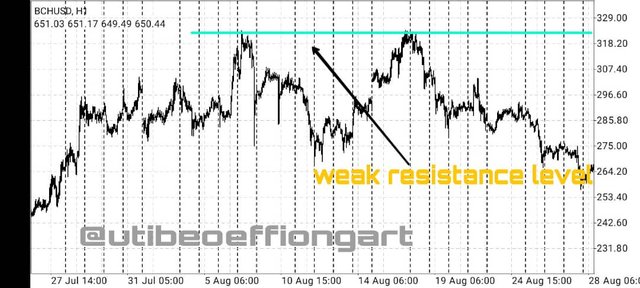
Weak resistance levels
Weak Levels graphically refer to horizontal lines of support or resistance on a market chat with which the price of an asset continuously interact with for more than two times. That is, these lines of resistance or support experience easy breakage and does not withstand the price movement strongly. The levels are unreliable as they can be bypassed by price easily. These weak levels do not have large influence or effect on the price of an asset.
While
Strong Level
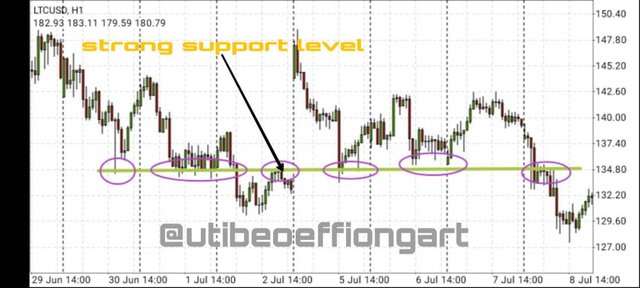
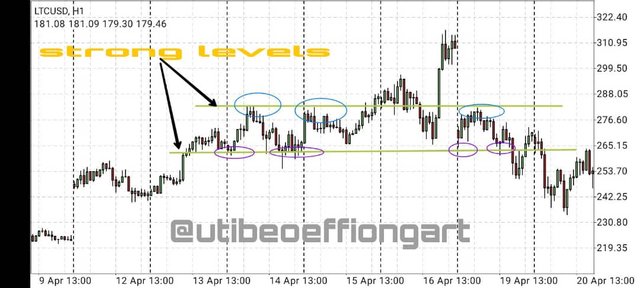
Strong Levels describes support or resistance lines that have prolonged interaction with the price of an asset. Here, you will find trends reversing once they get to these virtual horizontal support or resistance lines on many occasions. These levels interact with the price more than thrice over time. There is always a potential for price of an asset to be altered once it touches these strong levels. That is strong levels pose serious influence to price.
On these strong level, the price bounces off severally. What triggers these weak and strong levels and the mechanism they operate on is the presence of large accumulated pending buy or sell orders close to these levels such that when prices approach these point, the pending orders are triggered and begin to be executed such that there is influx of capital into the market thus altering the price of the asset. The prices will bounce off multiple times on a strong level if the amount of pending orders is large in opposition to the current trend.
For weak levels the price bounces off once or twice but since the amount of pending orders is not large, the level may be unable to resist or repel the trend and the price on subsequent testing. Large pending buy orders are used to reverse a downtrend while large pending sell orders are used to reverse an uptrend on strong levels.
Explain What a Gap is. (Required Screenshots) What Happens in the Market to Cause It.
A Gap
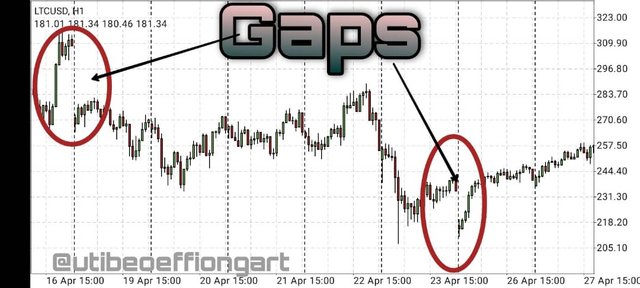
A gap is a situation whereby the price of an asset jumps or skips some levels and lands on another level instead of passing through the preceding levels. In market charts, gaps are seen as blank spaces where by the close of a candlestick is not followed by the open of a corresponding candlestick. These gaps represent quick market entry or exit in large amounts and volumes. Gaps can otherwise be called windows.
It is a portion of a chart which lies bare as a result of a new candlestick opening some distance above or below the closing price of the previous candlestick.
Cause
Gaps occur in the market once there is a major significant difference between the previous close price and the subsequent open price of an asset.
Also, whenever investors or traders significantly move or shift their bid and ask price, a gap may occur. At any point where the market sentiments chances quickly this will be accompanied by a change in the big price and ask price creating an interval in the market chart.
Explain the Types of Gap (Screenshots Required, it is not Allowed to Use the Same Images of the Class)
Types of Gap
Breakaway Gap
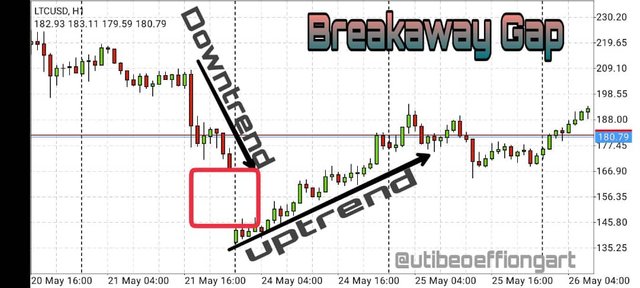
This gap represents the termination of a trend and the beginning of a new trend. It can also indicate a shift from horizontal range. These gaps have strong potentials as support or resistance levels. Breakaway gaps indicate a break in structure. They are found when a trend has ended and a new lev is started. The new level is usually higher in volume.
Runaway Gap
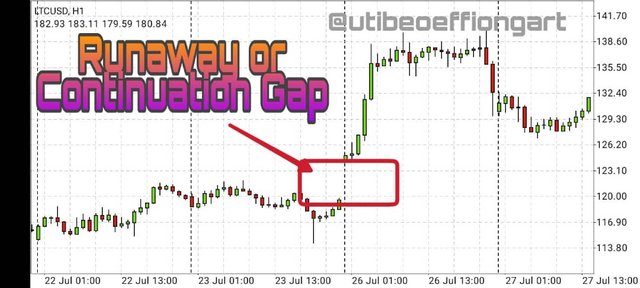
This is a gap that occurs along trend. The gap takes place in between a continuous trend. They are noticeable on newly moving trends and show that such a trend is going to continue and is still strong. This gap is otherwise called a continuation gap.
Exhaustion Gap
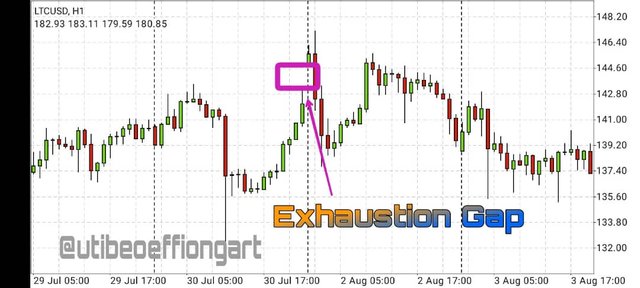
Just as the name implies, this gap occurs when a particular trend has lost its driving power and momentum and is about to end. This gap takes place when the sellers in a bearish market or trend have reduced supplying strength or when buyers in a bullish trend have diminshed purchasing power but attempt to make a final push to control the market. The exhaustion gap indicates an attempt to launch a final impulse as a trend approaches its end.
There is however another kind of gap I came across during my research. It is called
Common Gap
This type of gap is said to appear quite frequently without any pattern and of little significance. They do not represent and are not related to any movement or change in price. It usually has a very short space and offer little inference for technical analysis. Exhaustion gap occurs along an existing trend and indicates an impending termination of such trend.
Through a Demo Account, Perform the (Buy/Sell) Through Strong Supports and Resistances. Explain the Procedure (Required Screenshots).
Buy Chart.
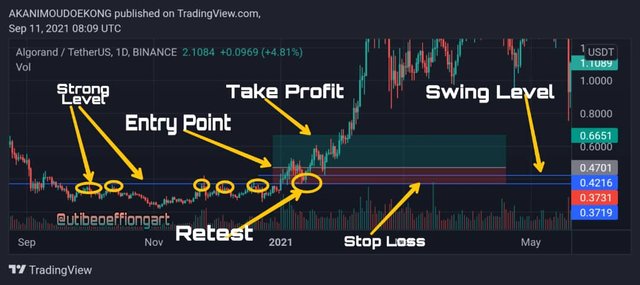
After locating the strong resistance point, I studied the chat and discovered a break out point. At that point, I noticed a retest. You can find that the strong level had connected more than three resistant point.
So I decided to use the break-retest-break (BRB) strategy. I was able to also find a swing level which I duly marked of.
My entry point was when the next bullish trend formed after the first long candle had closed after the retest.
I used a loss to profit ratio of 1:2. Placing my stop loss at the point o breakout on the strong level. My stop loss level was the same as the strong level. I kept my take profit up to twice the ratio of the stop loss.
Sell Chart
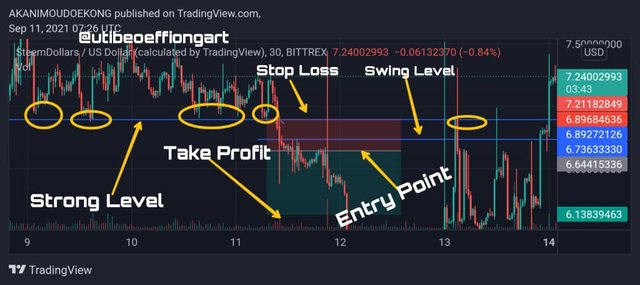
I first located a strong level. In this case it was a strong support level. Here also, I looked for he breakout point so I could take a trade. Here the market did not retest totally but there were retracements to form a swing level.
I entered the trade above the swing level where found the 3 black men and a bearish engulfing candlestick.
My stop loss and take profit were also in the ratio of 1:2 with my stop loss being at the strong level.
Through a Demo Account, Perform the (Buy/Sell) Through Gaps Levels. Explain the Procedure (Required Screenshots).
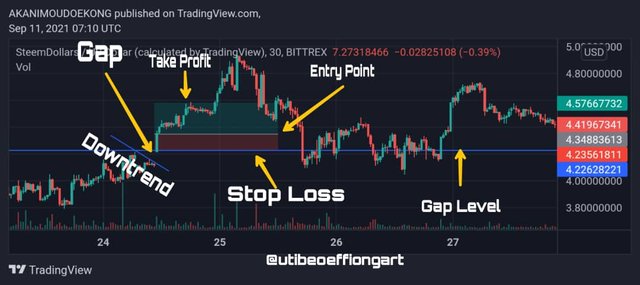
On the SteemDollar/USD chart. I was able to locate a gap. Front the structure, it is a breakaway Gap.
The initial trend before the gap was a downtrend as indicated on the chart.
So, I marked off the gap level which I used as the stop loss level. Loss to profit ratio was 1:2.
I waited for the first bullish candle to close and used the subsequent bullish candle as my entry point.
CONCLUSION
Though a fairly recent sector, blockchain technology and its encompassing interactions have diffused over the global space. Now, almost every region of the world knows something about cryptocurrencies. As a matter of fact, in some climes, it is becoming the mainstay of financial transactions.
The exchange or trading of cryptocurrencies is not a very easy endeavor. There are very serious technicalities associated with them. Infact, getting a favourable operation in the market is very tasking.
Yet, by understanding some basic concepts and principles the whole mysteries become very clear and even enjoyable. With concepts such as resistance and support, strong levels and gaps as thoughtin this lesson by Prof. @allbert, getting profitable orders and trading the market becomes an interesting thing.
There is so much content to be digested from the concepts discussed above and it seems quite interesting once it becomes clear. One can thus know where and when to comfortably enter the market and come out with an oversized pocket. Great lesson at Prof. @allbert, well done.