Steemit Crypto Academy | Season 3: Week 7 || How to create an account on TradingView, how to use indicators, tools, features of tradingview: by @small-ville

Defining the TradingView site
The trading view is a powerful Charting platform that provides users with a market analysis of different assets. It was founded in September 2011 by some group of Stan Bokov trading group. The trading view has a variety of indicators and a well-structured user interface for traders who want to boost their accuracy in predicting the market, also the platform is set up to allow traders to interact with each other and share trading ideas. The trading view is a web, App and subscription-based platform that allow the user to have at least a 30-day trial before they are given restrictions to the site.
How to register an account in Tradingview?
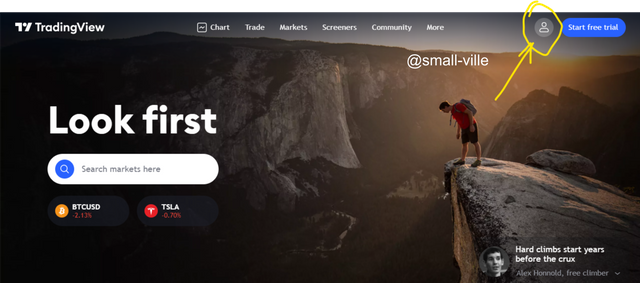
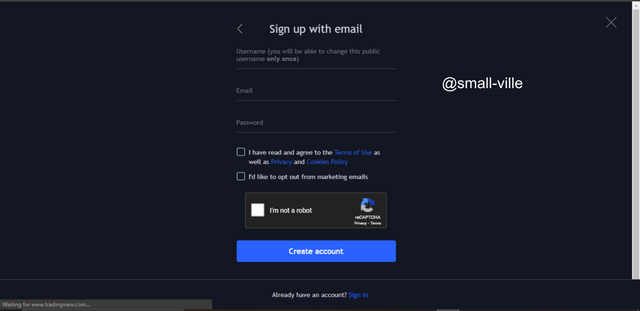
When you enter the signup page through the home page by using the Trading view site which is Tradingview.com, fill in your information and then click on create account create an account.
What are the different registration plan?
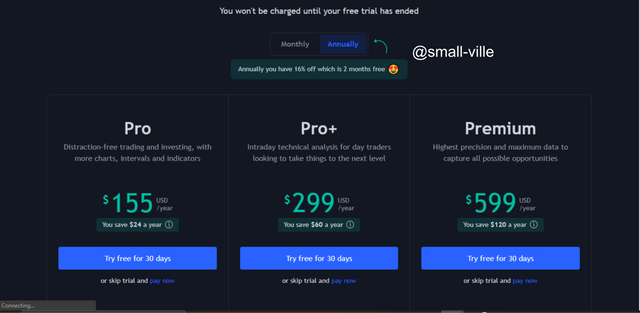
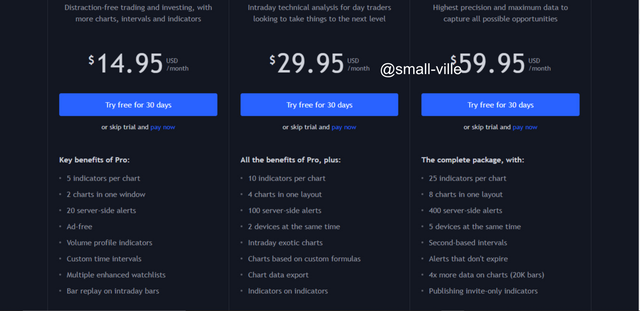
After successful signup and log in, the user is given an opportunity to start a 30-day free trial to explore the features of the trading view. If the user is satisfied after the 30 days he/she is then expected to choose a Monthly or Annual subscription plan on the platform of which there are 3 types.
They are;
PRO
Under the pro subscription, the user is expected to choose between the monthly and annual which is at a cost of $14.95 and $155 respectively. The user is rewarded with key benefits which include;
- An ad-free interface.
- A maximum of 5 indicators.
- A maximum of 2 charts for a window.
PRO+
The PRO+ subscription user is expected to choose between the monthly and annual which is at a cost of $29.95 and $299 respectively. The user is rewarded with key benefits which include;
- It can allow users to log in on a couple of devices.
- A maximum use of 10 indicators.
- A maximum of 4 charts for a window.
Premium
The Premium subscription user is expected to choose between the monthly and annual which is at a cost of $59.95 and $599 respectively. The user is rewarded with key benefits which include;
- It can allow users to login into a maximum of 5 devices.
- A maximum use of 25 indicators.
- A maximum of 8 charts for a window.
Explain the different features of trading view and what is your favourite feature and why?
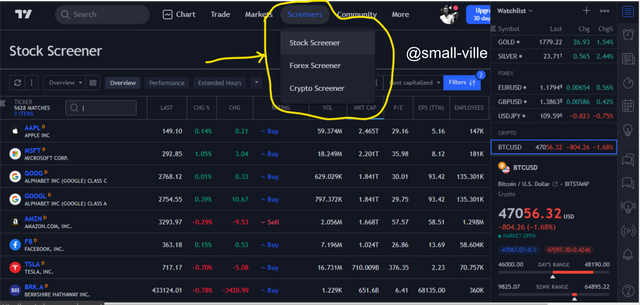
Screener:
This feature is used to identify assets which the user wants to invest in. It gives the user concise information about the particular trade which they want to explore, they are of 3 types which are, Forex screener Stock screener and crypto screener.
Paper Trading Simulator:
This is a feature mostly for the novice or people who are new to trading.
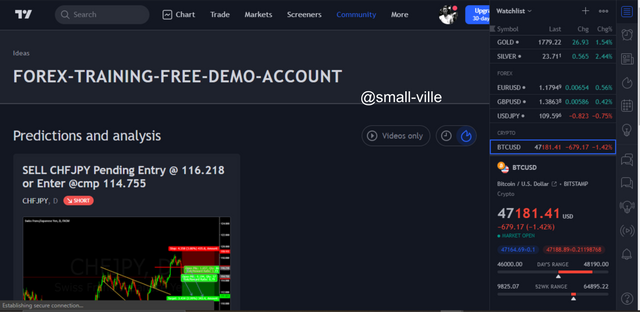
The feature provides a demo account with which they can use to trade any listed asset on the Tradingview platform. The feature helps the user to make riskless actions without consequences.
Alert Feature:
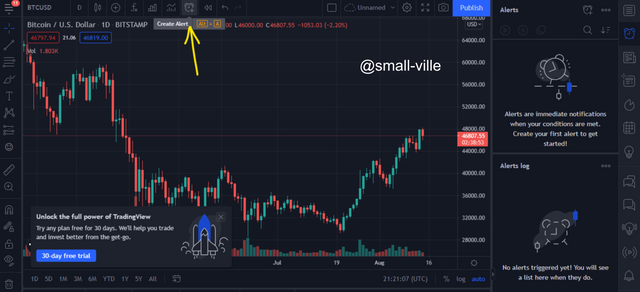
The alert feature is used to receive notifications, SMS, pop-ups and emails of different happenings in the market which could be a price change, an entry period or an exit period.
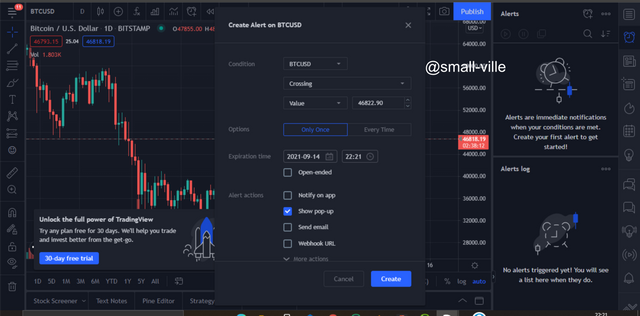
The user can also set the frequency to which he/she receives these Alerts.
My Favourite Feature:
The watchlist feature is my favourite feature on the Trading view because it keeps me informed on the recent happenings or updates of a particular asset.
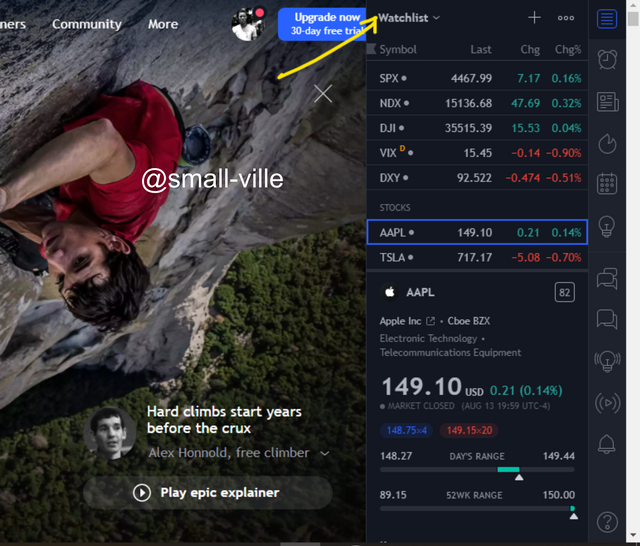
I do not have all the time to go about looking for information on different assets but with my favourites placed on the watchlist, I can have regular updates on them.
How to set up a chart in TradingView
When you go to tradingview.com the first thing you would see is the home page.
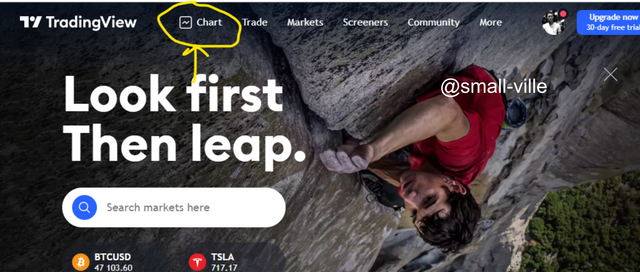
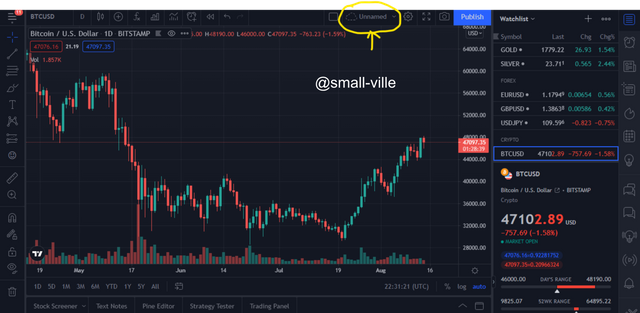
on the top part of the home page, you would see the Chart Tab, if you click on it you would be then directed to your chart display, which would be unnamed until you customise it to your preference.
How to use two tools to edit The Tradingview Chart
To customise or Edit the chart to a more desirable template that suits you better Right clicks on the chart display and click on settings. You would see a box that contains various tabs which include;
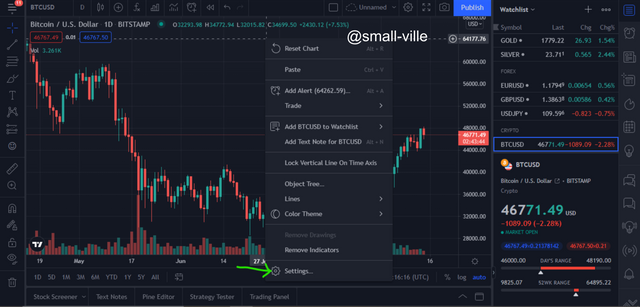
- Symbol
- Status Line
- Scales
- Appearance
- Events
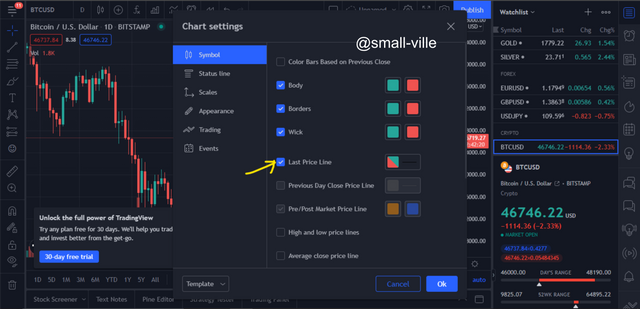
I will be using the Last line value and the Background colour to Edit the chart display. to do this I have to click on the symbol tab, then click on the Last Line Value check box. This will activate a line that follows the last known value of the asset on the display chart.
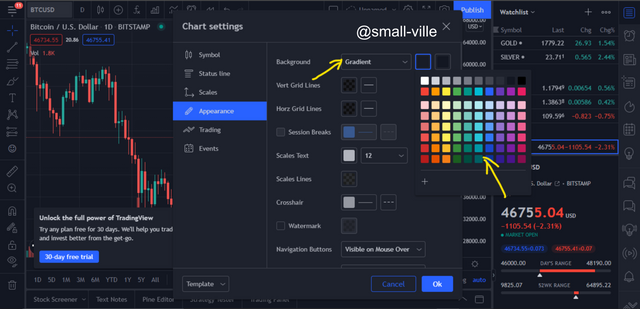
For the background colour, I will click on appearance and then click on the colour box next to it. This will bring out a colour palette with varieties to choose from, I then clicked on purple to change it.
Explain how to add indicator in chart
To add an indicator, click on the indicator icon.
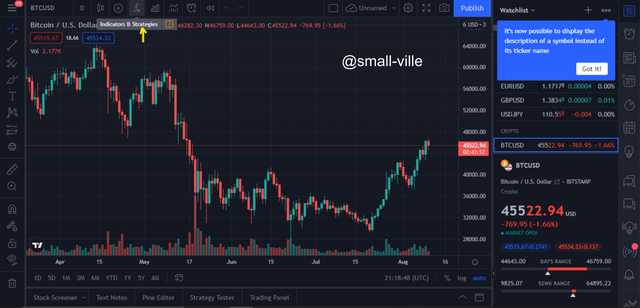
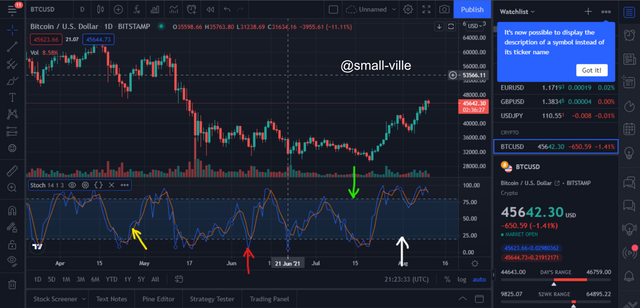
This will bring down a dropbox of different indicators then click on an indicator of your choice, in this case, I will be choosing the Stochastic Oscillator.
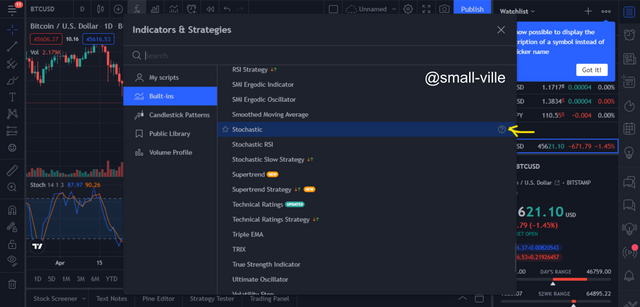
This will automatically be displayed on the display chart.
what is your favourite indicator and why?
My favourite indicator is the Parabolic SAR. This indicator is used to identify the market trend of a particular asset. The parabolic SAR is identified as dots that run above or below the price trend. When the dot run below the price trend it potentially means it is an uptrend and when it runs above it potentially means a downtrend.
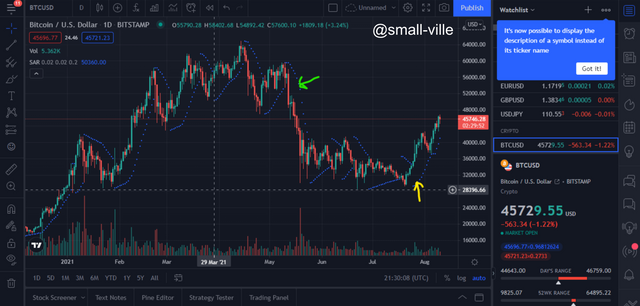
The reason why it is my Favourite indicator is that it helps me to know when there is about to be a reversal in market tren, also it helps me know when to make entry and exit orders when trading.
Do you think TradingView is useful in predicting the market for cryptocurrency (trend / price)?
Yes i think the Trading view is a very good platform that should be used in predicting the cryptocurrency market because these reasons are explained below
- Price Alert Feature:
The Trading View has a price alert feature that is used to set a notification on the desired price for a particular asset, this helps notify the user of the price action of that particular cryptocurrency. - Watchlist Feature:
This feature helps to update the user on the various cryptocurrencies which they have placed on the watch list. A watchlist is a selected list of different cryptocurrencies by the user in order to receive regular updates about them. - Technical indicators:
The Trading view is loaded with up to 25 Different Technical indicators which are used to give the best possible prediction of the market price action or trend.
Conclusion
This course is a complete tutorial for a new user of the Trading view who could also be a novice in the trading world. After a complete review of the Trading view, I must say that this is by far one of the best charting and analysis platforms, that should be used by every beginner or Pro-trader, because of its quality content.
A very much Thank you to Professor @yousafharoonkhan for this great Lecture.
Respected first thank you very much for taking interest in SteemitCryptoAcademy
Season 3 | intermediate course class week 7
thank you very much for taking interest in this class,