Steem/USDT Custom Indicator – Build Your Own Trading Tool
Aslamualikum
I hope you are all well and living your lives well. We will learn a lot in today's learning challenge Week 06.I welcome all the SteemitCryptoAcademy members who post onSteemitCryptoAcademy and send them my special Assalamu Alaikum.My name is Shiraz Ahmed and I live in Pakistan. I am a software engineer and I also do a job.Yesterday when I saw this post from Steemit Crypto Academy, I got busy creating this post and I had only one thing in mind, to bring something that hasn't been done before.
About Build in Indicator
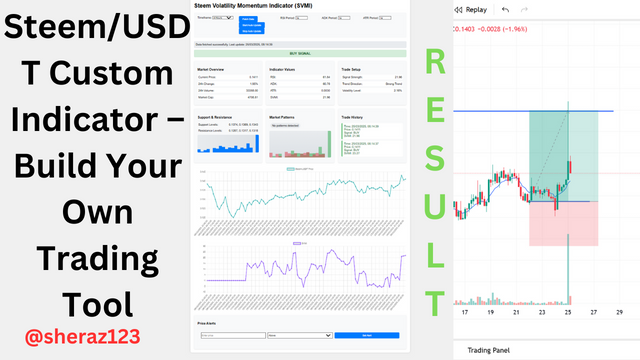
I have created this indicator myself and at the same time I have created this indicator like a website. Inside it I have created it using HTML, JavaScript and CSS language and have used Binance API to fetch the data.In this way, there are many benefits of creating our own indicators and using Binance's API. From this, we can get the data we want and we can see the signals according to our own formula. This will make it very easy for us to see the signals. This indicator will automatically give us a signal whether to buy or sell, but it will give it based on our formula and will not take any decision on its own.And we can also design this Hindi cutter as we wish. I have designed something in my own style which makes it easy for me to see the signal in it and use it further.
Binance API
The Banas API is a set of tools that allow programmers or software engineers like us to use its API to build any decision-making app for crypto, and the API is a set of tools that we can use to test the stats data.
Note
We can buy Banaz's API in some cases, but if we want to create such an indicator, we need it to be freely available to everyone. If you want to download it, you can go to this link.Binance API
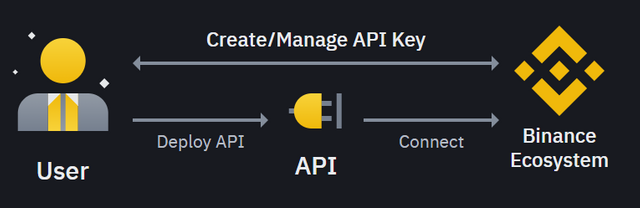
These screenshot tken by Binance API Page
1️⃣ Question 1: Why Build a Custom Indicator?
Why Design a custom indicator on Steem/Usdt?
I created my own custom indicator on Steemit so that I can get the output I want and I can modify it as I want so that it can give me signals on its own so that I don't have to do any calculations. Rather, I give it a formula so that it calculates itself and gives me a signal whether I should buy or sell. Also, there are no transaction fees on Steemit. There are big projects being built on Steemit, so there are a lot of transactions happening on Steemit. So, I had to create a custom indicator that gives me signals based on all these reasons.And creating this indicator will increase my crypto profits. I often trade inSteem/Usdt.
My indicator has a few limitations. If the market falls rapidly, it will fail to predict it, and at the same time, if the market rises rapidly, it cannot catch it either.And at the same time, there is a limitation in my indicator, even if there is a gap in the market, it cannot predict it or catch it. But my indicator has such a technology that if there is a gap in the market, it will not give any signal.But I have designed it in such a way that if there is a gap in the market, it will notify you first. But I cannot give any guarantee that it will notify you first or not. But if I look at my guess, it will definitely notify you first. Since I have written its code, I know how it will behave.
This is my custom indicator I created in the form of a website and behind it is using Binance's API, I have talked about it before.
2️⃣ Question 2: Your Indicator’s Concept
SVMI (Steem Volatility Momentum Indicator) Concept:
- RSI (40% weight): Measures price momentum
- ADX (30% weight): Measures trend strength
- ATR (30% weight): Measures volatility
Formula
SVMI = (RSI - 50) * 0.4 + (ADX - 25) * 0.3 + (ATR/Price) * 1000 * 0.3
Signal Generation Concept - Buy Signal: SVMI > 20
- Sell Signal: SVMI < -20
- Hold: -20 ≤ SVMI ≤ 20
How it Indicator Works: - Combines momentum (RSI), trend (ADX), and volatility (ATR)
- Weights each component based on importance
- Normalizes values for consistent comparison
- Provides clear trading signals
Key Features - Adapts to market conditions
- Reduces false signals
- Works in both trending and ranging markets
- Considers Steem's unique volatility
Why make it's unique?
First of all, its design makes it different from other indicators.And besides that, providing signals based on my formula by calculating it yourself is also a little different from other indicators. They also provide signals, but not in the way that this indicator provides signals by calculating them.SVMI is an indicator designed exclusively for Steem/USDT by combining momentum (RSI), trend strength (ADVI), and volatility(ATR) into singular signals for better performance. Unlike most indicators, it shifts with the market and avoids erroneous signals during extreme volatility periods. It also comes with a simplistic +20/-20 system which makes decision making easier. Since Steem is its main focus, the indicator is able to perform better than the overall average, making it more useful.
3️⃣ Question 3: How to Use It
This indicator tells us when to buy or sell and when to hold the purchased coin.But I have created this indicator specifically for Steem, so it will only give signals for that. Applying the same signal to any other coin can be harmful to you.If SVMI rises above +20, it will give a buy signal.And on the other hand, if SVMI is below -20, it will give a sell signal.And working on the same concept, if SVMI falls between +20 and -20, it will give a hold signal.But this indicator is designed in such a way that it gives its opinion according to every hour and every minute, but it can give a better opinion about four hours. You can use it on a four-hour time frame.
You can check the uptrend by checking the signal of SVMI above +20 or -20.
.png)
Here you can see that my indicator gave a buy signal within the four-hour time frame, so now we also look at the market to see if the market is going to go up or not.
.png)
And here we really see that the market is now going towards the trend. The market has once gone towards the uptrend and then returned, which confirms that the indicator is giving the right signal.
.png)
If you look again at the screenshot of my indicator above, the indicator has also said that a double top has occurred and you can see it on the graph as well.And if you look at the results of my indicator, you can see support and resistance on the indicator screen, and believe me, support and resistance are the same as what we see in the graph. The indicator is really working very well. You can use it in your daily trading, but the steem/usdt token.
You should remember that you have to trade with the trend and not trade against the trend. In case of a large gap, this indicator does not give a signal and at the same time, if there is a lot of flow in the market, then this indicator can also give a wrong signal. You must remember that you should trade with the world by graphing, but I have designed this indicator in such a way that you will see a graph inside it.
.png)
.png)
I have brought a feature in my indicator that if you fetch and don't click on autofetch, the data is fetched once and stops. With this, you can check the entire previous block, i.e. trades, and if you do autofetch, this graph will change automatically from time to time.
Before placing your trade on this single, you must also place your stop-loss and take-profit order. Place a stop-loss order as much as you can tolerate. I talked about this in a previous post on this SteemitCryptoAcademy Steem/USDT Order Book Trading – Mastering Market Liquidity Strategies.So if you want to understand this in detail, you can read this post of mine, it will benefit you a lot.
4️⃣ Question 4: Pros & Cons
The combination of momentum, trend, and volatility analysis makes SVMI a powerful tool on its own. It reduces noise and enhances clarity of the market’s reality; SVMI is designed specifically for Steem/USDT, so it can more precisely adapt to high volatility. The simple +20/-20 signal system eliminates the confusion that usually comes with decision-making. It is also more user friendly as it caters for different time frames and works in both trending and ranging markets.
Like every powerful tool, SVMI comes with a few shortcomings. Fast traders such as scalpers may be unable to achieve their desired results because it requires at least 20 data points. The tool may lag during extreme volatility, meaning that traders will have to posses adequate knowledge of the current market environment to utilize SVMI. For optimal performance, data quality combined with regular parameter changes is vital.
To maximize results, SVMI can be paired with other tools to achieve better accuracy. Particularly, SVMI best performs on 4-hour (4H) and daily timeframes when the market is calm and clearly trending. It is particularly effective for trend following, swing trading, and position trading. Instead of a standalone tool, SVMI should be used in conjunction with price action, volume analysis, market sentiment, and proper risk management.
5️⃣ Question 5: Case Study or Backtest
I have just shared this indicator with four or five of my friends and I have also benefited from it myself.And from this I have made a couple of trades, some on a lower time frame and some on a higher time frame. I have taken these trades on a drawing frame of about four hours and after looking at the signal from my indicator, see the result.
.png)
Entry Point0.1337
.png)
Exist Point0.1549
.png)
Stop Loss0.1234
| Entry Price | Close Price | Quantity | Total Buy Cost | Total Sell Value | Profit (USDT) | Profit (%) |
|---|---|---|---|---|---|---|
| 0.1337 | 0.1547 | 1000 | 133.7 | 154.7 | 21 | 15.71% |
And this trade of mine lasted for more than four hours, after that this profit came and I shared it with some of my friends, one or two of them used it, they made a profit of about 36-37 dollars using it and they also traded at the same point.
I am invite some other users
@sun-developer
@syawalkoki
@reportup
@yangyang
Source This indicator
I have uploaded the complete source code of this indicator to GitHub. You can download it from there and use it.