Crypto Trading With Volume Indicator - Crypto Academy / S4W2 - Homework Post for @kouba01
Greetings all and welcome to my blog as I attend this week's assignment from @kouba01 on the volume indicator.

1. Explain the volume indicator in your own words.
Volume indicator is an indicator which gives a representation of the trading volume of an asset over a specified or given period of time(say 24 hours) in a graphical form.The volume of an asset helps push the market. To know the volume in a current market, we use what is called a volume indicator.
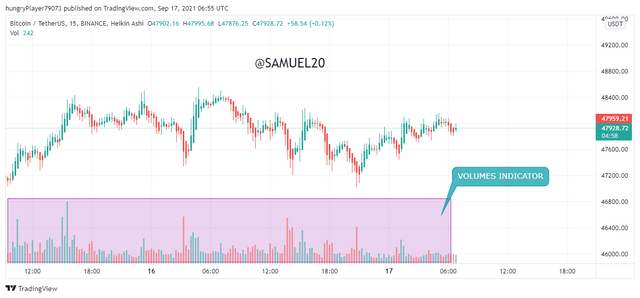
Usually located below when one newly launches his or her chart, a volume indicator can be identified as an indicator that helps us to know the current volume in the market or the volume used to take out support and resistance levels. knowing the volume used to break these key zones helps us know if a break is sustainable and also to check if a trend has enough volume in it to keep moving in that direction. When referring to volume, I mean the number of orders in the market on a pair be it buying and selling orders. The more of these orders, the more the volume in the market with regards to the asset. We can take a look at the indicator on the chart below:
2. Use a platform other than Tradingview to present the volume indicator on a chart and show how to configure its parameters by justifying your choices. (Screenshot required)
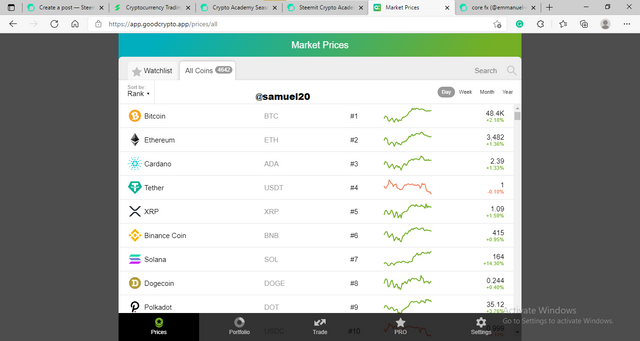
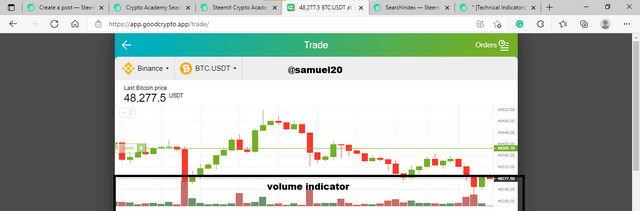
For this answer, I will be using the stormgain app to answer this question and we locate stormgain using this linkhttps://app.goodcrypto.app and the page open up as seen below.
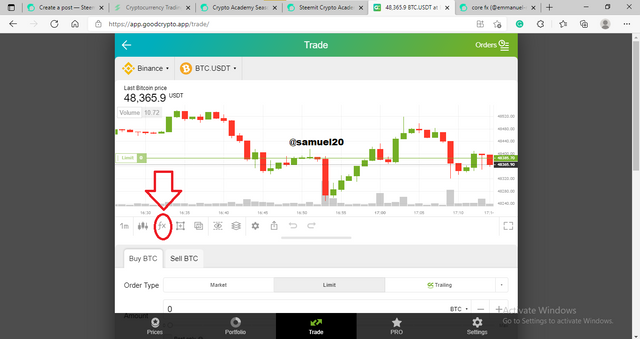
Then we click on trade below to be taken to a page where we see the charts as seen below :
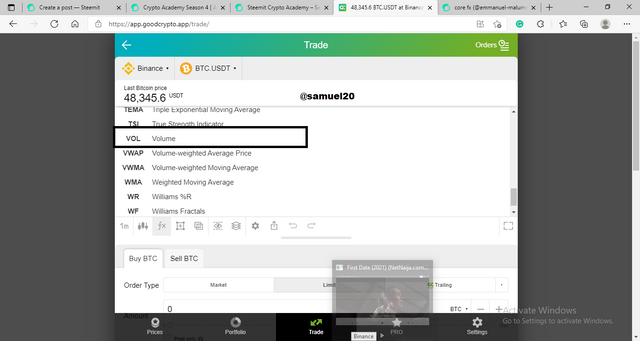
We now click on the indicator sign as indicated below
Then scroll down to the volumes indicator and click on it and then we have it loaded on the chart
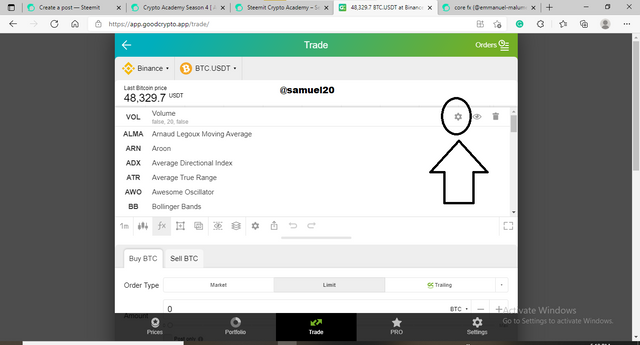
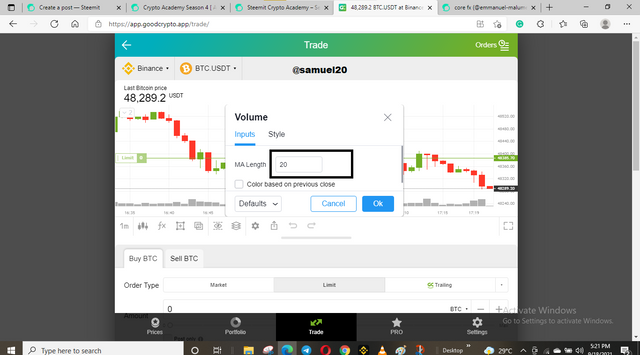
To configure it, I clicked on the settings tool as identified below and I will be using the default setting at 20 cause it's very effective for me especially when I combine it with the moving average
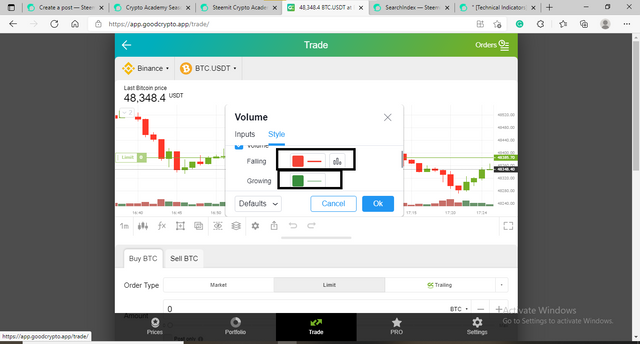
I now decided to check the style out and for the differentiation between bullish and bearish volume, I would be changing the color of the volumes with falling been changed to red and growing in green
The chart appears as below
3. What is the link between Volume and Trend and How to use volume to predict a trend reversal? (Screenshot required)
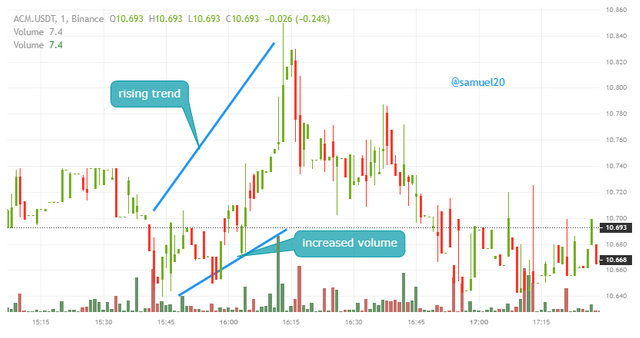
Trading with trends is an ideal approach in trading,it is advisable to trade with these trends, it would be good to trade only strong trends but we can't know these with our physical eyes and this is where the volume indicator helps us. For a trending market, it is good to see volume increasing as the trend increases showing that the trend is strong and there is enough volume pushing the market either upward or downward. so the volume indicator helps us know if a trend is sustainable so let's look at examples below:
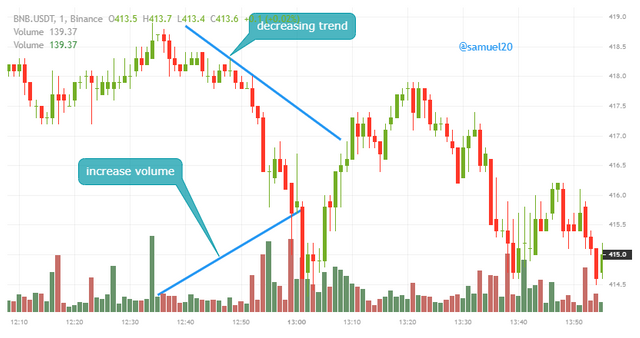
The same thing can be seen in a downtrend as seen below
Question 3b - How to use volume to predict a trend reversal?
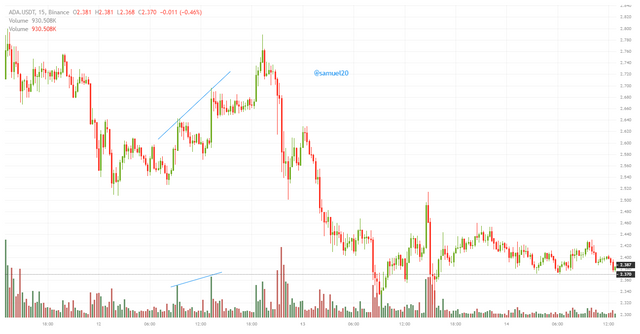
Here we observe this when the direction of trend opposes that of the volume direction. Here the market would be in an uptrend but we see volume decreasing instead of increasing. So when we see the directions opposing each other it means that the volume pushing the market in that direction has reduced meaning that we should be open to seeing a change in market direction soon. let's look at different examples below:
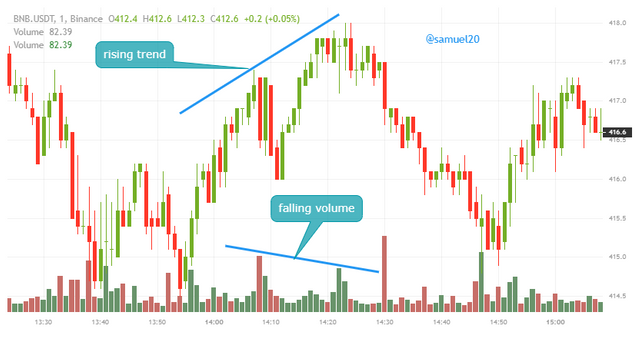
Looking at the chart above,there is an uptrend market while the volume was decreasing and what came next was a change in market direction.
4. How to use the volume to have a signal confirmation? (Screenshot required)
This is used for confirming breakouts in the market so that we can know it's not manipulation in the market. so when we see a breakout be it through a support or resistance level, we look at the volume indicator, if this breakout occurred with a strong volume, we can look at the breakout as a confirmed breakout cause the volume was big enough. Let's look at some examples below:
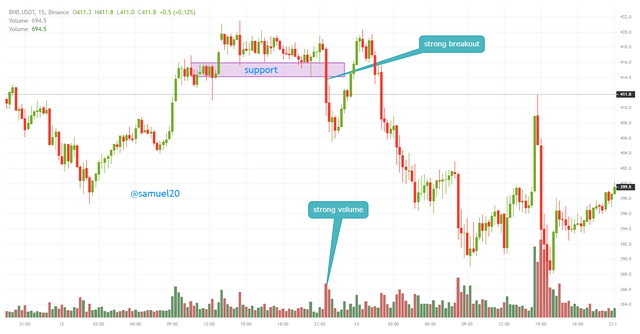
In the chart above, wee price break out of support with sufficient volume, and what followed was a drop in price after a retest. we confirmed this breakout using the volume indicator
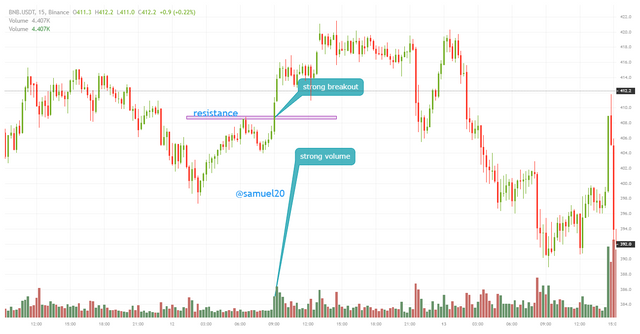
for the bnb chart above, we saw a break from resistance with a strong volume and this confirms a break and we see price keep moving up from there
5. How does the volume reflect the evolution of prices in the charts and why does the volume sometimes anticipate the price? (Screenshot required)
Here we are using the change in volume to predict how the price would turn out with the spikes in volumes. so we use a dormant market where suddenly we see a significant spike in price if after series of ranging candles lets say 15 previous candles we see the market been dormant without any significant change and suddenly we see a spike in volume, we can take this as a sign that more buyers or sellers have entered the market so we prepare to move in that direction too immediately .examples can be seen below:
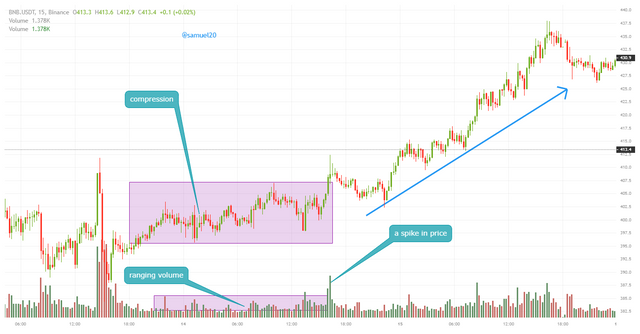
Here price seemed to be ranging with volume and then suddenly we see a spike in price from the range and we saw price breakout from the range to start moving up showing us that we can use the volume indicator to predict price next actions.
Using this as criteria can also fail you whereby we see different spikes in volume but price not necessarily moving in any direction but rather price keep ranging
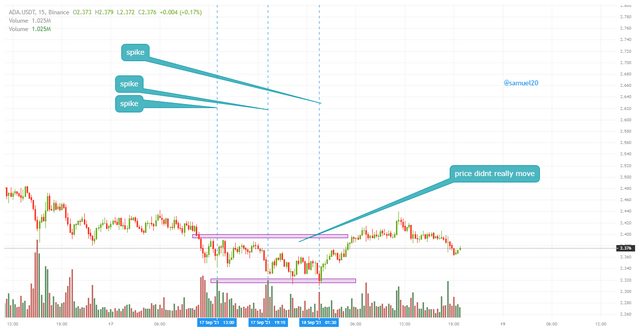
We can see above how price keep giving signs of breaking out but kept staying in the range
6. Is it better to use the volume indicator alone or use it in parallel with another indicator when trading? Justify your answer
It is not good to use the indicator alone rather, it is good to use it in combination with other indicators such as the moving average(MA).Using this we can be able to eliminate the amount of losing trades while increasing the accuracy of the indicator.
We will be using another volume indicator to help increase the accuracy of this indicator too. so for this, we will use the ADX, a popular indicator that helps us know if there is a trend or not with the following settings below
0 - 25: The trend is weak or there is no trend at all.
25 - 50: There is a trend going on in the market.
50 - 75: The current trend is very strong.
75 - 100: The trend is very extreme.
so let's look at the chart when these two are together and see how using the two together helps eliminate false signals for both. It is quite important to note that there must be confluence before taking a trade when using this together.
WITHOUT THE ADX
A trader trading only volume indicator would have taken that trade expecting the uptrend to keep moving upward but look at what happens when you combine the ADX indicator, you would not have taken this trade as seen below:
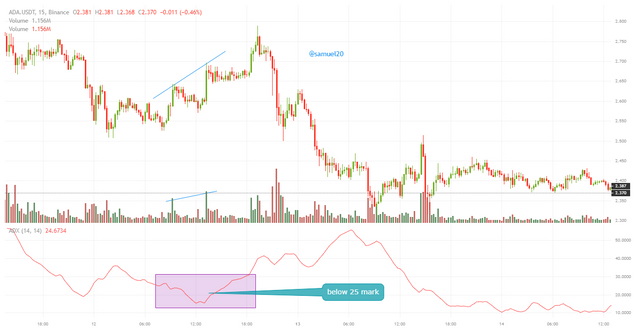
So we can the adx line is not above 25 so you won't have taken the trade. using the adx line helps eliminate these kinds of trade for us as traders
7. The volume indicators are multiple, choose one of them to briefly explain its usefulness in crypto trading.
For this answer, I will be using the Chaikin Money Flow indicator which I would load on my chart first as seen below before talking about it
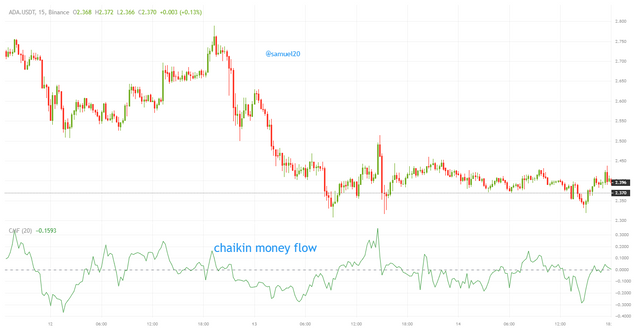
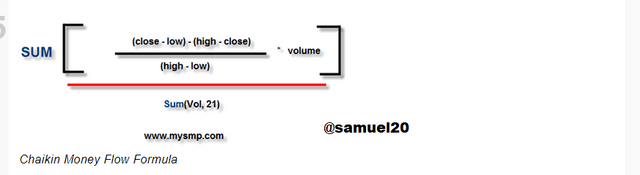
This indicator works as an oscillator which helps show us the volume in the market at a particular time and using divergence that occurs on the indicator when we see a divergence in the indicator we can use this to take trades. The formula for calculating it is ;
HOW DO WE USE THIS TO TAKE TRADE
We see a trending market and to know if the volume in price is reducing we see divergence on the indicator and then we can take trades off this divergence
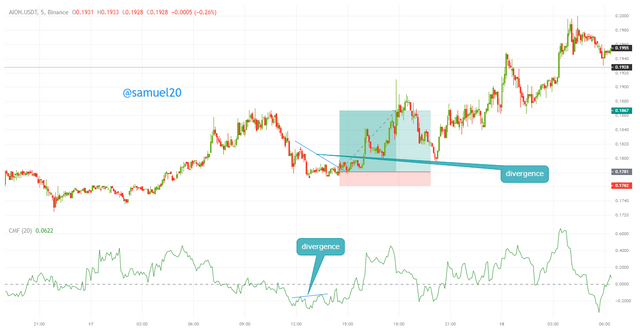
Looking above, we see a divergence in a market formally trending downwards and then we see a divergence in which we can predict that price is about to change and the trend is losing steam so we expect a change in market direction

8. Conclusion
Volume indicator is a very good and nice indicator used for trading which helps us know when there is enough volume in the market to move it in any direction or if a trend is weak without enough volume helping us eliminate entering those types of trades. As usual, indicators are perfect so using the indicator in combination with other indicators gives us an edge in the market. Thank you @kouba01 for this lecture
Hello @samuel20,
Thank you for participating in the 2nd Week Crypto Course in its 4th season and for your efforts to complete the suggested tasks, you deserve a Total|7.5/10 rating, according to the following scale:
My review :
A good article in which you were able to answer most of the questions ably, and you have some notes that I made.
Thanks again for your effort, and we look forward to reading your next work.
Sincerely,@kouba01
Thank you prof @kouba01
I will do better in your next class.