[On-chain Metrics(Part-3)]- Steemit Crypto Academy- S4/W5- Homework Post for professor @sapwood


(1) How do you calculate Relative Unrealized Profit/Loss & SOPR? Examples? How are they different from MVRV Ratio
The RUPL (Relative unrealized profit or loss) is basically a type of general on-chain metrics which account for the unrealized value of an asset either in the form of profit or in the loss by calculating the difference between market capitalization and realized cap at the time of considering the total supply of that asset at any given interval. The realized cap and Market Cap I have discussed in the previous part.
Mathematically, Unrealised profit / loss = Market Cap - Realized cap.
We can also say that the Unrealized Profit/Loss is given to be the loss or profit that a UTXO can have incurred if it has been moved. The realized price is the price of coin the price when the coin was last moved is the realised price. When we multiply the current price of the coin with the number of coin which are in circulation we get the market value. We can get the answer of an important question by the unrealized profit/loss and that is, if all UTXO's were spent today, then how much profit or loss would be incurred.
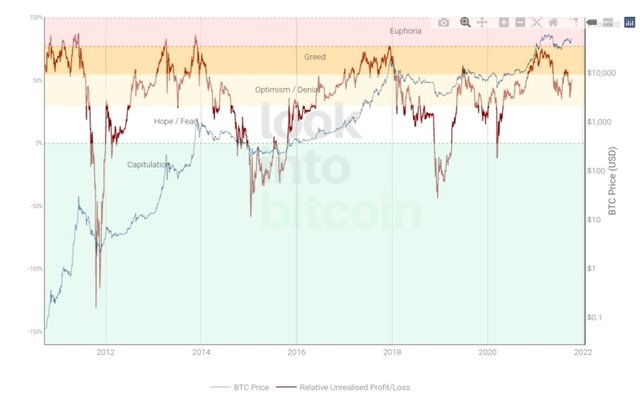
Screenshot from lookintobitcoin
If the results are positive, then it indicates that the current price is above the realized price and this signals an unrealized profit. On the other hand, the negative result indicates that the current going price is below the realized price (price at which is was last moved) and it signals an unrealized loss.
If you want to calculate the relative unrealized profit/loss with respect to the corresponding time and market cap, divide the unrealized profit/loss i.e. the difference of market cap and realized cap by market cap.
i.e. Relative unrealized profit / loss = ( Market cap - realized cap )/Market cap.
Lets take an example:
Lets suppose there is an asset A. Suppose the market cap of A is $50,100,00 and a realized cap of $30,200,00. Then, the unrealized profit/loss and the relative unrealized profit/loss is calculated as follows:
- Unrealized Profit/loss
The unrealized profit/loss of the asset A is as follows:
Unrealized profit / loss = $50,100,00 - $30,200,00
Unrealized profit = $19,900,00
As the difference results a positive value, so the Crypto A has network unrealized profit of $19,900,00.
- Relative unrealized profit/loss
Now, the relative unrealized profit of crypto A is as follows:
Relative unrealized profit / loss = ($50,100,00 - $30,200,00) / 50,100,00 = 0.3972.
Hence, the Relative unrealized profit/loss = 0.3972 and this is equivalent to 0.40 after round off.
With the relative unrealized profit of 0.40 shown above, we can observe that the crypto A is within the greed zone, and if the relative unrealized profit approach to above 0.75, this indicates an anticipation in a dip and a historical cycle top.
The Spent output price Ratio (SOPR) is a
typee which sorts out the ratio of a price of spent UTXO to that initial price of the UTXO at a creation. The evaluation of the on-chain metrics is used to determine the top and bottom points within a cycle.
Actually, the spent output price ratio represents the amount of realized profit for all the coins which are transferred on blockchain. The SOPR which is above 1 indicates that a higher swing is approaching in the price whereas a SOPR reading which is significantly below 1 indicates the price is approaching a lower swing. SOPR of exactly 1 shows that the coin moved the day is on average, selling coin is at breat even.
The Spent Output price Ratio of an asset over a period of time can be calculated by dividing the price at which the coins sold by the price at which the coins were bought i.e.
SOPR = Price of Coin Spent / Price of Coin Bought
Example:
Like in the previous example, suppose a Crypto asset B which has a spent UTXO of 15 X and it is at the current market price of $200. The 15 A was created at the initial price of $110. So the SOPR will be calculated by the formula:
SOPR = Output price Spent / Initial price created
The Initial created price = 15 × $110 = $1650
&, Spent output price = 15 × $200 = $3000
Therefor, the spent output price ratio will be calculated as:
Spent output price ratio = $3000 / $1650 = 1.818
Hence, SOPR is 1.818 which by round off is equal to 1.82.
Since the above calculated SOPR is more than 1. It means that the investor of Crypto B is in profit of 81.81 %.
DIFFERENCE BETWEEN RUPL, SOPR AND MVRV
RUPL: RUPL (Relative unrealized profit/loss ) is an on-chain metric which mostly focuses on unrealized profit/loss to the market capitalization ratio. This shows the final unrealized profit or loss of an asset with respect to the circulating supply. It identifies historic tops and bottoms.
SOPR: The SOPR (Spent Output Price Ratio) focuses on actuall profit or loss sustained by the investors for spending their asset at a given interval. Thus it shows the net profit or loss ratio of spending a Utxo with the current price of market.
MVRV Ratio: The MVRV (market-value-to-realized-value) ratio as from the name, It indicates the ratio of the market cap to the realized cap of an asset. There is also an overall value of the network which is identified by it in terms of undervalued and overvalued at the time of giving signals for potential moves. It is all about determining the trends in the market.
(2) Consider the on-chain metrics-- Relative Unrealized Profit/Loss & SOPR, from any reliable source(Santiment, Glassnode, LookintoBitcoin, Coinmetrics, etc), and create a fundamental analysis model for any UTXO based crypto, e.g. BTC, LTC [create a model to identify the cycle top & bottom and/or local top & bottom] and determine the price trend/predict the market (or correlate the data with the price trend)w.r.t. the on-chain metrics? Examples/Analysis/Screenshot?
REALITIVE UNREALIZED PROFIT/LOSS:
As I have already explained that the relative unrealized profit/loss on-chain metrics is sort to determine the unrealized cap with respect to the market cap and time is in profit or loss. The RUPL shows the cycle tops and bottoms. If we see that the relative unrealized value is between 0 and 0.25, we can consider it a historical cycle low and when above 0.75, it is considered as a historical cycle top.
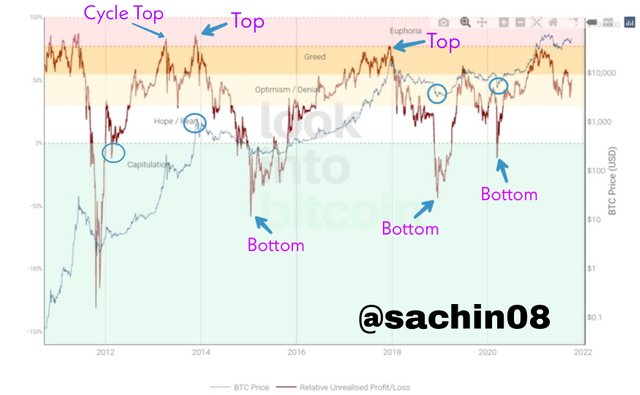
Screenshot from lookintobitcoin and edited
● Analysis of 10 Years BTC RUPL:
From the chart shown above, there are five different levels which are differentiated by 5 colors bands and indicates Capitulation, Fear/Hope, Optimism, Greed, Euphoria. These different levels explain the different behaviors of the traders and holders of the Relative unrealized profit/loss (RUPL).
It is seen from the above chart, the price went four times in the euphoric zone and then reversed from there in a small interval of time.
From the birth of bitcoin, we have observed that when RUPL was at 0.82, the btc has made its first 2 digit top of 11th june. Then, a bear cycle has started and it made a low of about $4 with RUPL -0.13. Then, again a bull trend has started in BTC it made the double top from April 2013 to November 2013 and at that time RUPL was above 0 at 0.83.
Then, again a bearish pattern observed and a bottom cycle was formed in January 2015 at about $200 and the Relative unrealized profit/loss ratio went below 0 i.e. at -0.55 at that time. Then, after a long time of 2 years in 2018, there has seen a bullish move and the coin again touched a historic high around $19000 and the Rupl was at 0.78 in the Euphoric zone.
The next year phase was also about 3 years long which is similar to a big bull run and the RUPL came two times below 0 and it makes a double bottom at 3230 with a RUPL of -0.44 and 5230 where the RUPL was around -0.12.
Then, after the double bottoms, the btc has remained is a continuous uptrend and made many tops and bottoms but unfortunately, it was unable to make a new historic top by reaching the euphoric phase.
The RUP-L is a function of market capitalization & realized cap. From the above information, it is observed that RUPL has shown good good correlation with the movements of price and the tops and bottoms acts as a good trade signal.
SPENT OUTPUT PRICE RATIO:
SOPR is an On-chain metric which helps to identify the local tops and local bottoms in bullish and bearish phase. It looks at sum of the ratios of coins spent to their value when it was bought. This shows that when the holders of coins spent their coin, then whether they made a profit or loss.
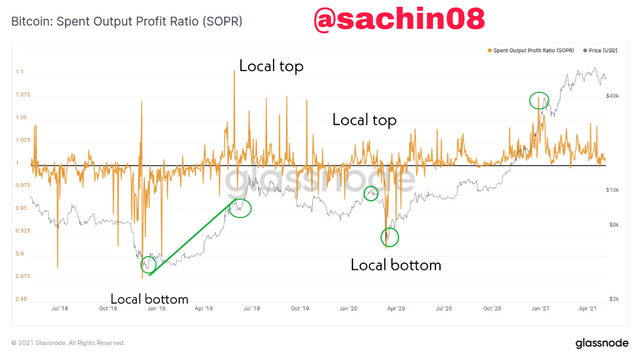
Screenshot taken from glassnode and edited
In the above chart of btc, after bottom in December 2018 a euphoric phase is yet to come so for this analysis. Here I have chosen the time period of December 2018 onwards. There is a bullish cycle in which there were many local tops and local bottoms which is shown in the image above.
Basically, when the SOPR moves above than 1, then there is a local top formed and when the SOPR moves below than 1 then a local bottom is formed. By seeing this, it is measured. The SOPR metric can be used by the trades in combination with the other indicators so that they can identify the buy and sell signals.
In the bull cycle, when SOPR reaches around 1, it is considered as a buy signal and when it reaches around 1 in the bear cycle, it is considered as a sell signal. Thus, SOPR shows a good concentration with price and it is used to show local tops and bottoms. The significant local bottoms always led to an uptrend in price which indicates a level of strong support.
(3) Write down the specific use of Relative Unrealized Profit/Loss(RUPL), SOPR, and MVRV in the context of identifying top & bottom?
There are different uses of the three on-chain metrics: Relative Unrealized Profit/Loss(RUPL), SOPR, and MVRV.
• Relative Unrealized Profit/Loss:
RUPL (Relative unrealized profit/loss) is an on-chain metrics which uses the unrealized profit and loss ratio in order to identify the cycle tops and cycle bottoms in the market with respect to the market cap and relative time. Each RUPL level is represented by corresponding cycle which are euphoria, greed, hope, Optimism and Capitulation.
When the reading of relative unrealized profit/loss is above 0.75 then it indicates that the price is approaching a historic top where there is a possiblity that the price can meet a bearish resistance as a result to take profit by the investors. When the reading is below 0.25, then it indicates the price is approaching a historic low where there can occur a potential price accumulation.
• Spent Output Price Ratio:
The SOPR is an On-chain metrics which identifies swing tops and bottoms in line with the overall trend through its calculations and chart representation. SOPR of an asset can be calculated by dividing between the sell price of the coin and the initial creating price of the UTXO.
The SOPR reading above 1 indicates that the price is approaching a swing high and the SOPR reading below 1 indicates that the price is approaching a swing low.
• MVRV Ratio:
The MVRV ratio is an on-chain metrics which indicates the overall state of the market as overprice or underpriced with respect to the corresponding market cap and realized cap to identify the market tops and bottoms.
The market tops of the MVRV ratio signifies a potential sell off although such can not be guaranteed. The market bottoms which signifies the accumulation can be relied upon as a signal of buying. Adding the tops and bottoms can be used to identify the trend in the market. If the trend goes sideways and if we see a gradual down trend then we can take a long position at this time.
Conclusion
The Relative unrealized profit/loss, as discussed above is an on-chain metrics which is used to determine the tops and bottoms of the market. It is calculated by the difference between market capitalization and realized capitalization. This is used for short term price analysis. The Spent Output Price Ratio metrics is used to sort the ratio of a price of UTXO spent to the initial price of creating of UTXO. The MVRV ratio is already discussed in the part of the lecture and it is basically the ratio of market cap to the realized cap of asset.
The lecture of professor @sapwood has proven much beneficial and knowledgeable for me. I have got much information about the on-chain metrics from this lecture and I have got much interest in doing this post. Thanks to professor for this insightful lecture.
Cc:-
@sapwood
@steemcurator01