Technical Analysis Strategies for Crypto Trading
Hello everyone! I hope you will be good. Today I am here to participate in the contest of Steemit Crypto Academy about the Technical Analysis Strategies for Crypto Trading. It is really an interesting and knowledgeable contest. There is a lot to explore. If you want to join then:

Question 1: Foundations of Technical Analysis
Explain the principles of technical analysis in cryptocurrency trading. Discuss key tools such as trend analysis, support and resistance levels, and chart patterns, with examples relevant to the Steem/USDT market.
Technical analysis is an important method which is used to evaluate the markets. It helps to analyse the financial markets by analysing the historical price movements of the assets. It also involves focusing the trading volume and the psychology of the market. This is not like the fundamental analysis where we focus on the intrinsic values. In the technical analysis we assume that all the information of the market is already reflected in the price of the assets. Technical analysis helps the traders to identify the potential entry points and exits points. In the technical analysis we use different patterns technical indicators and the trends of the price.
Key Tools in Technical Analysis
There are different key tools used in the technical analysis. Some of them are given below:
- Trend Analysis
- Support and Resistance
- Chart Patterns
Here is the detailed information of all these technical analysis tools:
Trend Analysis
This is used to identify the direction of the market. This is important for the determination whether the market is in the bullish trend or bearish trend. It also helps to identify if the market is in the sideways or the choppy zone which is also known as the accumulation zone.
Uptrend:
This is the trend phase where the market forms higher highs or lower highs. It indicates the bullish trend in the market the most awaited phase in the market for the investors. So the bullish market arises when the market is forming the higher highs or the lower highs.
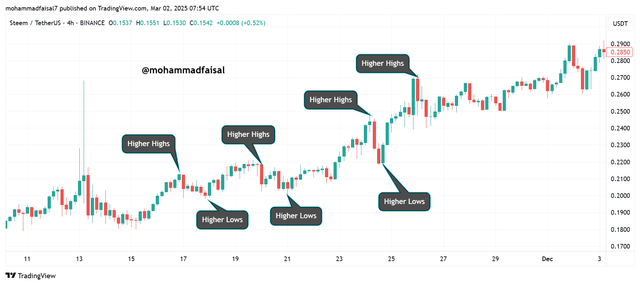
Here I have highlighted the an uptrend of the Steem/USDT where the chart is forming higher highs and higher lows which indicates an ultimate downtrend.
Downtrend:
Downtrend as from the name it is indicated that this is the specific zone in the market where the prices follow an uptrend. This is the reversal phase which starts after the uptrend where the smart investors distribute their holdings to the retails investors. It happens due to the continuous selling pressure in the market. The market forms lower highs and the lower lows in the downtrend.
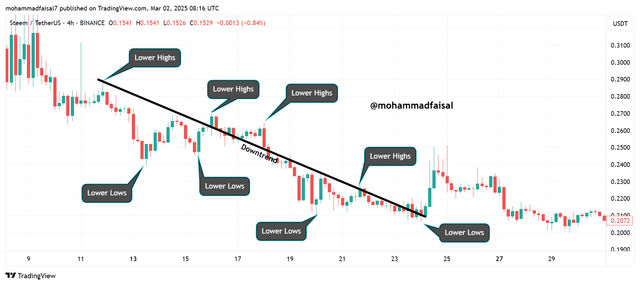
Here I have highlighted the a downtrend of the Steem/USDT where the chart is forming higher lows and lower lows which indicates an ultimate downtrend.
Sideways Trend:
This is a trend in which the market moves within a specific range. It is also known as the accumulation phase, choppy zone or the consolidation phase.
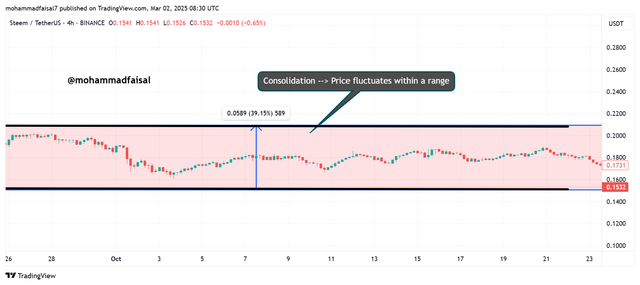
You can see in the above picture of Steem/USDT the market is moving in the specific range in the 4 hours timeframe. This sideways trend is the opportunity for the investors to accumulate the assets as much as they can because after the sideways trend the uptrend starts.
We can use other tools for the trend analysis such as moving averages, relative strength index, and trend lines.
Support and Resistance
Support and resistance both are the important technical analysis tools which are very useful to understand the breakthrough of the price and the reversal of the trend in the market. Both are opposite to each other.
Support:
This is the zone where the price starts bouncing in the upward direction because in this zone the demand of the asset is high and due to this increased demand people buy the asset vigorously and in this way the price bounces back. It prevents the price from further decline.
Resistance:
Resistance is the zone in the market where the demand of the asset is decreased and due to this decreases demand the prices go down. Actually in this phase due to low demand the price is rejected to go more upward but it comes back to the downward direction. At this phase the users often sell their assets.
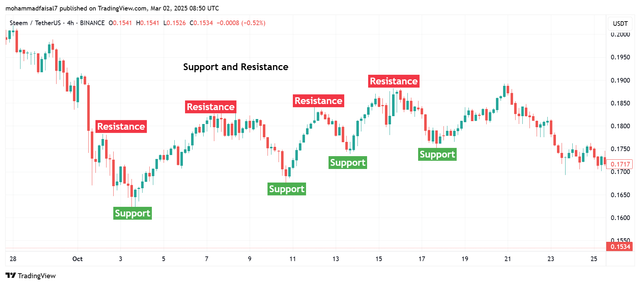
Here in the above chart of Steem/USDT I have spotted some areas where the support and resistance is happening. You can see that at the resistance the price is always bouncing back to the upward direction to the demand zone.. On the other hand at the resistance level the price is always rejected due to the selling pressure or low demand of the asset in the market. Each support zone is the buying opportunity and each resistance zone is the profit taking opportunity.
Important thing to note is that if the price breaks above the resistance zone with high volume then it confirms the bullish upward trend. On the other hand if the price breaks below the support level then it indicates that the price can go down further. We should focus on the volume as well while using support and resistance levels in the technical analysis.
Chart Patterns
Chart patterns are also very important technical analysis tools which help the traders to find out the market moves before the happening of the breakouts.
Reversal Patterns:
These patterns in the charts indicate the changes in the trend of the market. There are different reversal patterns some of them are given below:
Head and Shoulders: These patterns of the charts indicates the reversal of the trend fro the bullish phase to the bearish phase.
Inverse Head and Shoulders: This reversal pattern of the charts indicates the reversal of the price from bearish to bullish momentum.
Double Top: This reversal pattern of the chart presents a bearish reversal pattern which forms two peaks and then the price goes down.
Double Bottom: This reversal chart presents a bullish reversal pattern which occurs when the chart forms two lows. After the formation of two lows bullish trend starts.
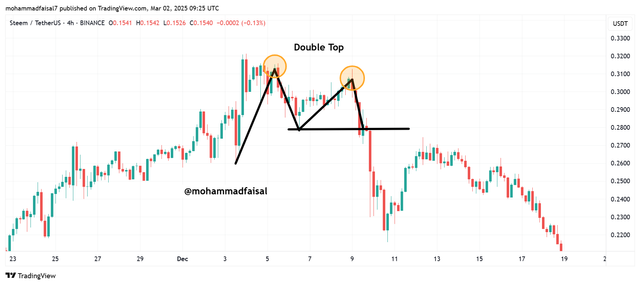
Here you can see in the chart where the chart is making double top pattern. This pattern is indicating the upcoming bearish trend and it happened accurately that after this pattern the price of Steem went down following the pattern.
Continuation Patterns:
The continuous patterns tells the traders that the existing pattern will continue. If the current trend is bearish then these patterns will help to identify whether this pattern will continue or not. There are different types of continuous patterns as given below:
Triangles: These continuous patterns indicates the potential breakout of the direction. These may be ascending, descending or symmetrical triangular patterns.
Bullish & Bearish Flags: These patterns confirms the continuation of the trend after the consolidation phase.
Cup and Handle: These cup and handle patterns signals a consolidation pattern before the breakout of the price. It is actually a buying opportunity before the breakout of the price.
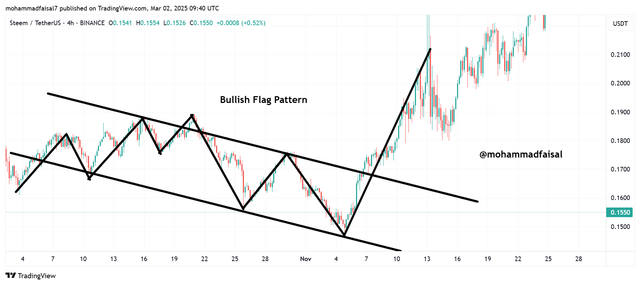
This is the bullish flag pattern of Steem/USDT. This formation of pattern is very complex but we need to understand the formation of this pattern. We can see the result of this pattern that the bull flag pattern led to the uptrend in the price of the Steem/USDT. This is how the chart patterns help us to identify the upcoming trends of the chart.
Technical analysis help the traders to identify the valuable patterns such as the reversal of the trends and the breakthrough of the trends. The traders can combine the support and resistance levels and chart patterns the traders can make the informed decision. These technical analysis helps to reduce the risks while increasing the chances of profit.
Question 2: Applying Indicators for Decision-Making
Using historical Steem/USDT data, demonstrate how to apply a technical indicator (e.g., RSI, MACD, or Moving Averages) to make trading decisions. Provide a practical example with entry and exit points.
We can apply technical indicators to the historical data of Steem/USDT. This can help the traders to make good trading decisions which can help them to gain profits and to avoid loss. Using the indicators the traders can prepare themselves for the next move of the market. I will use RSI indicator to determine the different moves of the market in the historical chart of Steem/USDT.
RSI indicator is a momentum indicator. It measures the speed and the change of the price movements on a scale. This scale varies from 0 to 100. In the RSI indicator there are different phases which define the overbought and oversold condition of the market.
Oversold:
Similarly oversold is a condition when the value of the RSI indicator is below 30. This suggests a potential buying zone for the traders and from this oversold zone the price bounces back in the upward direction because of buying pressure.
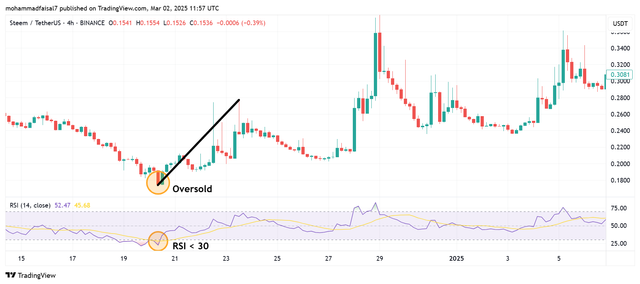
In the above chart I have enabled RSI indicator which is visible below the chart. We can see that the value of the RSI indicator is below 30 which indicates an oversold condition in the market of Steem/USDT. If we look in the chart when the RSI was below 30 then the price fell down due to huge selling pressure and after this the price rose up considering the oversold as a buying opportunity. The smart investors identified this level with the help of the RSI indicator and they made profit as after the oversold condition the market pumped a lot. Here the bottom level served as a support which pumped the price to go upward.
Overbought:
According to the RSI indicator overbought is a condition when the value of the RSI rose above 70. Overbought suggests that this is the selling point and it is possible that at each overbought the price retests itself.
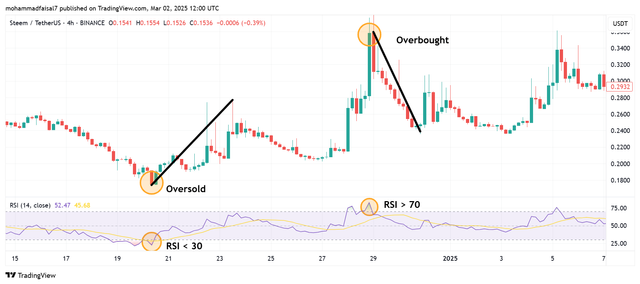
Similarly you can see the overbought situation in this chart with the help of the RSI indicator. The market behaved correctly at the overbought condition. We can observe the value of the RSI indicator was above 70 and it suggested an overbought condition. The smart investors took this opportunity to lock their profits. And right after the overbought condition the market retested itself and the prices went down from the peak level. Here the peak level served as a resistance which rejected the price to go downward.
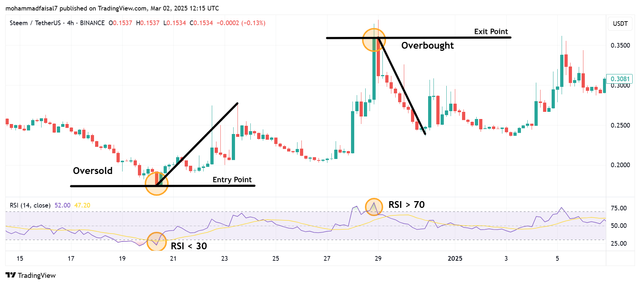
Here from this chart we can understand the entry and exit points by applying RSI indicator.
Entry:
When the value of the RSI goes below the 30 then it suggests an oversold condition and we should wait a bit to take entry in that situation. We should note that when the RSI value crosses above the 30 then it confirms the upward bullish trend and we can take entry at this point. After the breakout the price will go out and it will help the traders to take good profits.
Exit:
When the value of the RSI goes above the 70 then it suggests the overbought condition. This is where the traders should exit their entry. It is the level from the price take a reversal and it goes down. So the traders should take this opportunity to exit their entry and take profit.
Now I am going to show you to use MACD indicator to determine the entry and exit points. There are different points owes to the MACD indicator which help us to understand the entry and exit points based on the bullish and bearish crossover of the MACD line.
Bullish Crossover:
Here in the bullish crossover the MACD lines crosses above the signal line. As soon as it crosses above the signal line then it confirms the bullish uptrend. So we can identify the bullish trends with the help of the MACD.
Bearish Crossover:
When the MACD line crosses below the signal line then it suggests bearish trend. So as soon as the MACD line crosses below the signal line it confirms the bearish trend which leads to price to go in the downward direction.

Here in this picture I have denoted bearish crossover and bullish crossover. I have indicated bearish crossover with red colour and bullish crossover with green colour. We can see when the MACD line is crossing below the signal line then the price is going downward because of the bearish trend. On the other hand when the price is crossing above the signal line then price is going in the upward direction because of the bullish trend. So MACD helps us to identify the bullish and bearish patterns.
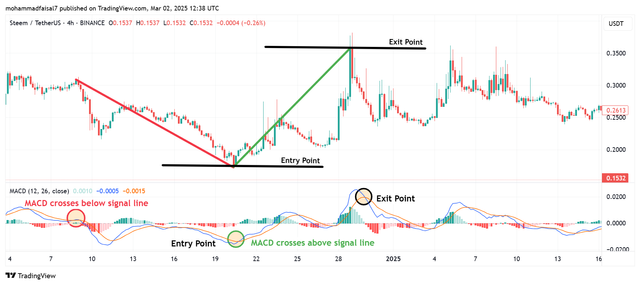
When the MACD line crosses above the signal line then it suggests an entry point. This bullish crossover and this is the great opportunity to take entry in the market. We should keep an eye on the MACD line to crossover the signal line to take entry in the market. On the other hand when the MACD line crosses below the signal line then it suggests the exit point. It is the good signal to exit the trade when to accumulate profit and avoid loss in the trade.
So we can use RSI and MACD indicators for the Steem/USDT to identify the potential entry and exit points. We can know the bullish and bearish trends with the help of these indicators.
Question 3: Utilizing Chart Patterns
Analyze how common chart patterns like triangles, double tops, and head and shoulders formations influence trading strategies. Use a chart to illustrate how these patterns help identify market trends.
In the above question 1 I have already discussed some common chart patterns. I would like to quote all those patterns here as well.
Triangles
Triangle chart patterns occur when the price movement converges and the movement of the price forms a triangular shape. These patterns indicate the consolidation periods before the breakout of the price. There are three main types of the triangle patterns:
Ascending Triangle: These patterns are known for the horizontal resistance line and an upward support line. This pattern indicates a bullish breakout of the price.
Descending Triangle: This is opposite to the ascending pattern. In this pattern there is a horizontal support line and a downward resistance in the form of the slope. This pattern indicates a possible breakout towards the bearish trend.
Symmetrical Triangle: This triangle pattern is formed by the convergence of the support and resistance lines. It indicates the breakout in the either direction.
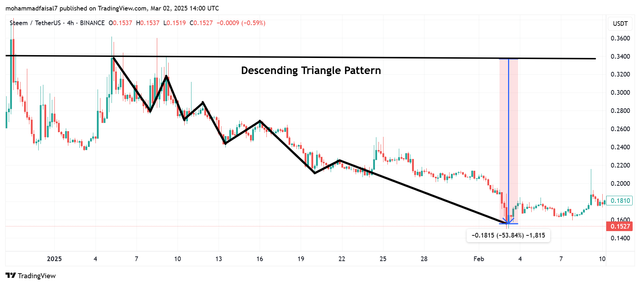
Here I have taken the example of the Descending Triangle. This descending triangle is forming a bearish pattern while the price is going in the downward direction continuously. This pattern started from the price of around $0.34 and this pattern led the price to move 53.84% in the downward direction.
At the end of this pattern the price was at the level of $0.1562. So it is easy to say that when the descending triangle pattern is formed then the market goes bearish. And it is the opportunity for the traders to save themselves from the potential losses due to bearish trend.
So we can say that these patterns help us to understand the breakouts of the price. We can identify the potential breakouts with the triangle patterns before the happening of the upcoming movement of the price.
Double Top
A double top is a bearish reversal pattern. It occurs after the uptrend. It is formed with the two peaks at the similar price levels. It indicates that the price of the asset is trying to break the resistance level but unable to break it. It suggests a potential trend reversal to the downward direction.
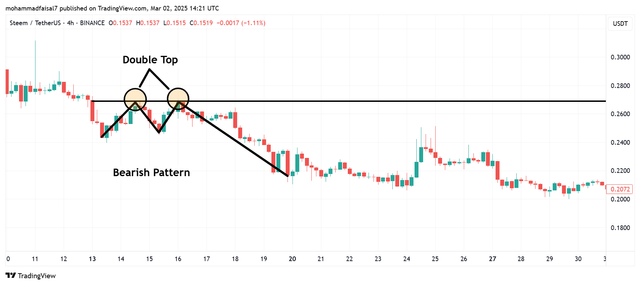
Here I have found a double top pattern in the Steem/USDT chart. This chart is the evidence that the double top pattern brings downtrend. After the formation of the double pattern the prices goes in the downward direction. It can be analyzed that the price formed two peaks at the same price levels which suggested a double top and thus leading to a bearish trend.
We can say that if a double top pattern is formed then the traders should become more vigilant and they should exit their trades to avoid the losses in the trades. It is the best time to take out the long position. On the other hand the traders can take short position after the confirmation of the trend.
Head and Shoulder
Head and shoulder pattern suggests the trend reversal from the bullish pattern to the bearish pattern. It consists of three main components which are given below:
Left Shoulder: This is a peak of price which is followed by decline in the price.
Head: After the left shoulder this is the higher peak than the previous but it is also followed by a decline in the price.
Right Shoulder: This is another peak of price but lower than the shoulder and it is also followed by a decline.
All these three components make the head and shoulder pattern.
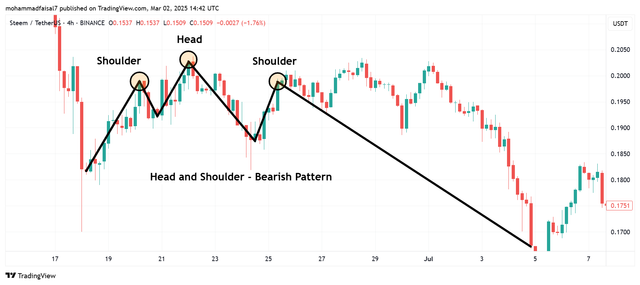
Here I have identified a head and shoulder pattern about the Steem/USDT chart. We can observe that before the formation of the head and shoulder pattern the market was in the uptrend. This is what this pattern says that it reverses the bullish pattern to the bearish pattern.
First of all at the left side a peak of price was formed followed by a decline in the price. Then the price rose again with the higher peak and then again it was followed by the decline. This price again tried to rise up and make a price peak lower than the head and it was followed by a decline in the price.
We can see that after the completion of the head and shoulder chart pattern the price started moving in the downward direction from the bullish pattern to bearish pattern. So the head and shoulder pattern gives an important indication to the traders to close their long trades to avoid potential losses. It is how we can use head and shoulder pattern to understand and identify the different market trends.
Question 4: Developing a Technical Strategy
Design a trading strategy for Steem/USDT that incorporates multiple technical indicators. Explain how your approach adapts to different market conditions, such as breakouts, consolidations, or reversals.
To develop a good trading strategy for the Steem/USDT I will use the following indicators:
- Support and Resistance levels
- Bollinger Bands
- MACD
- RSI
I will develop different trading strategies depending upon the condition of the market such as a breakout trading strategy, consolidation and reversals trading strategy.
Breakout and Reversal Trading Strategy:
I will use the following indicators for this breakout trading strategy:
- RSI
- MACD
- Bollinger Bands
- Support and Resistance
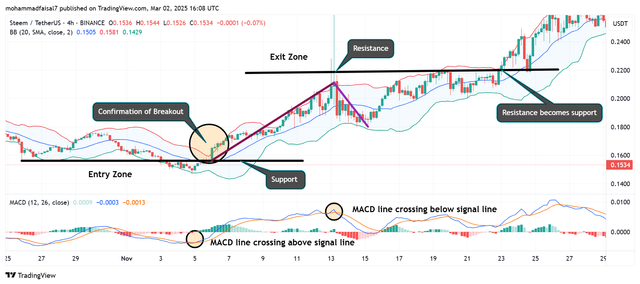
In this chart of Steem/USDT I have designed a breakout strategy using different indicators. I have combined the impact of all the indicators for the confirmation of the breakout. For the entry and the confirmation of the breakout I have used Bollinger Bands, MACD, and Support level.
When the price crosses above the SMA line of the BB then it suggests a bullish trend but we need to wait for the confirmation of the breakout. For the confirmation I have analysed MACD indicator along with the support level. I saw the MACD was also giving the same signal because the MACD line was crossing above the signal line. Moreover the price was at the level of the local support.
When I saw the price crossed above the upper band of BB then it confirmed the potential bullish breakout of the price. So in this trading strategy of breakout it is the zone to take a long entry in the market when the price crosses above the upper band and the MACD line also crosses above the signal line.
On the other hand when the MACD line crosses below the signal line then it suggests a bearish or the reversal zone from that level of price. Moreover when the price touches the resistance level then it suggests the retest of the market.
Here at the resistance zone the price again crossed the upper band representing a long bullish trend but with the analysis of the resistance and MACD indicator I came to know that this is the exit zone of the market to save the profit. And after the retest of the market I can take a new and fresh entry again if the breakout pattern is confirmed with these indicators.
Consolidation Trading Strategy:
For the consolidation phase I will use the following trading indicators:
- RSI
- Bollinger Bands
- Support/Resistance levels
Consolidation phase is also known as the sideways phase where the price moves in a specific range. I have designed a trading strategy for the consolidation phase.
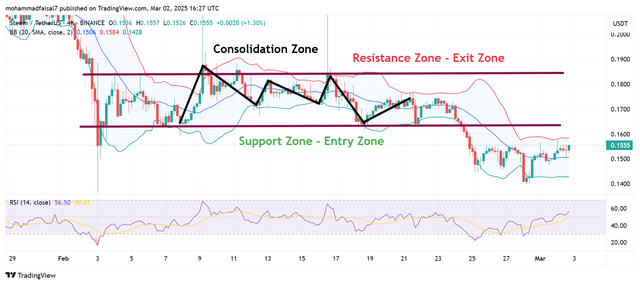
The above chart shows the sideways pattern of the market and the market is moving between the support and resistance levels. I have combined the BB, support and resistance and RSI indicators for the trading strategy for this phase.
Each support point in this consolidation phase represents an entry zone and this entry zone can be confirmed with the bands of the bollinger band and with the RSI value. When the price moves above the SMA line and the RSI indicator is near 30 then it is a by signal or in other words the traders can take entry in the market.
On the other hand in this consolidation phase when the price touches the resistance zone, the price moves below the SMA line of BB and is near the RSI value 70 then it is the exit zone. The traders can exit their trades in this situation and they can wait to get another chance to take a re-entry when the price touches the support zone.
In this way a trading strategy in the consolidation phase can be designed and operate with the help of the different technical indicators.
Question 5: Lessons from Real-Life Scenarios
Discuss a real-life or hypothetical scenario where technical analysis played a critical role in a trader’s success or failure. Reflect on key takeaways to improve future strategies.
Technical analysis play an important role in the determination of different market scenarios. They always play a critical role in the market. I will take the example of the Steem/USDT to explain how the technical indicators suggested the recent dip in the market and a downtrend in the price of Steem/USDT.
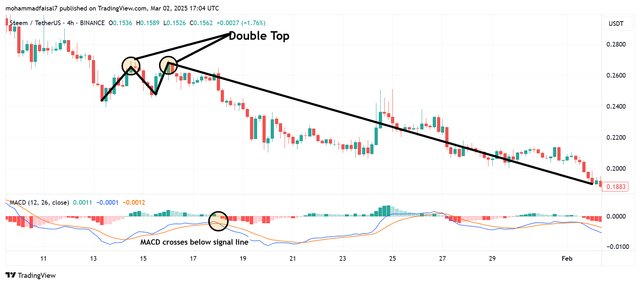
Here I have combined two different technical indicators a double top chart pattern and MACD indicator for the confirmation the double pattern's next movement. On January 25 the complete double top pattern was formed on the 4 hour timeframe. We know that the double bottom chart pattern is the sign of the reversal of the previous bullish trend to the bearish trend.
You can see as soon as the double top pattern was completed the MACD indicator also confirmed the bearish pattern of the Steem/USDT market. So we can see how accurately these two technical indicators determined the next move of the price of the Steem/USDT.
This pattern has played a great role for the success and the failure of the traders. It played a successful role for those traders who understood this pattern carefully and they exited their long trades in the Steem/USDT trading and in this way they locked their profits and saved themselves from the potential losses. On the other hand these technical analysis played a failure role for those who were not aware these patterns and scenarios so they did not understood the market and they faced potential losses because of the bearish trend.
Future Strategies:
On the basis of these analysis of the technical indicators for the Steem/USDT chart I can add an important strategy for the traders who are not aware of the technical indicators. The traders should always be active and vigilant to find the bearish and bullish patterns to take advantage of those patterns. If the chart forms a double top pattern then it suggests an upcoming bearish trend. At that point the traders should confirm this pattern the next movement of the price with the help of the other indicators such as RSI, MACD, Support/Resistance levels to save themselves from the potential losses.
Technical analysis are the powerful tools for the good trading decisions. We can use key indicators such as MACD, RSI, Moving Averages, Chart Patterns and Support/Resistance for the better decisions of taking an entry to the market or to exit from the market. With the help of the technical indicators we can identify the potential breakouts and reversal in the market. We can never deny the importance of the technical analysis for the good trading strategies.
Note: All the charts used in the post are taken from TradingView.
Wonderful 👍,,,
Good luck bro such an amazing participation by Your side...