Steem/USDT Order Book Trading – Mastering Market Liquidity Strategies
Hello everyone! I hope you will be good. Today I am here to participate in the contest of Steemit Crypto Academy about the Steem/USDT Order Book Trading – Mastering Market Liquidity Strategies. It is really an interesting and knowledgeable contest. There is a lot to explore. If you want to join then:
1️⃣ Question 1: Understanding the Order Book in Steem/USDT Trading
Explain the fundamentals of the order book, how it works, and why it is crucial for traders. Compare order book trading to traditional technical analysis.
We often listen about the order book whether in the traditional trading or virtual cryptocurrency trading. But many of us does not know about order book working and purpose.
In cryptocurrency an order book is a real-time digital record of all the orders such as sell and buy orders. But at a time it shows digital re ord of order to the user about a specific trading pair which a user selects such as Steem/USDT. Order book provides information of depth and liquidity. It helps the traders to understand the sentiment of the market and potential movements of the price.
Fundamentals and Working
The order book consists of three main sections:
- Buy orders or Bids
- Sell order or Asks
- Depth or Liquidity
Buy Orders (Bids)
In Steem/USDT trading pair these are all the orders from the traders where they are willing to buy Steem at a specific price. These orders in the order book are arranged in descending order. In this order the highest bids of the prices remain at the top. The bid which is highest is known as the best bid. It is the price which a buyer is willing t pay to buy Steem/USDT and similarly it is same from other trading pairs.
Sell Orders (Asks)
These are the orders from the traders in the order book where the traders are willing to sell their Steem tokens at a specific price. The traders ask for the price to sell their steem. It is arranged in the ascending order where the lowest ask price remains at the top. The lowest ask is known as best ask. This is the price where the seller is completely willing to sell his assets.
Order Book Depth (Market Liquidity)
The gap between the best bid and the best ask is called as the spread. If the spread is tight then it represents there is high liquidity in the market which is favourable for the quick trading for the traders. High liquidity allows the users to buy or sell their Steem at the most reasonable prices and without any significant difference between the bid and ask. If the spread between the ask and bid is high then it represents low liquidity in the market. It causes slippage in the price.
Steem/USDT Order Book
Here is the simple represemtation of the order book of Steem?USDT trading pair. It is how the order book of Steem/USDT should look like on the exchanges.
| Bid Price (Buy Orders) | Quantity (STEEM) | Ask Price (Sell Orders) | Quantity (STEEM) | |
|---|---|---|---|---|
| $0.1445 | 500 | $0.1455 | 300 | |
| $0.1440 | 700 | $0.1460 | 450 | |
| $0.1435 | 1000 | $0.1465 | 600 |
According to the above order book of Steem/USDT:
The best bid or the highest price to buy Steem is $0.1445. On the other hand the best ask or the lowest sell price is $0.1455.
The spread is $0.0010 which becomes 0.69%. This spread is neither too tight nor loose but it is a moderate spread which represents moderate liquidity.
There are a large number of buying orders below $0.1445. This large amount of buy orders represents the strong support at this point. It is sure that when the buying order will be placed with the increasing demand and the price will rise from area.
Why is the Order Book Crucial for Traders?
Order book is crucial for the different purposes for a trader. Some of them are given below:
Identification of Support and Resistance Levels
In the order book the big bid orders act as support levels. It is possible that the price will bounce from here. On the other hand the big ask orders act as resistance levels. It is possible that the price takes correction from the resistance.
Understanding of Market Sentiment
If the buy order exceed the sell orders then there is string buying pressure in the market. So in this situation the order book shows bullish momentum. Alternatively if the sell orders exceed buy orders then there is the strong selling pressure in the market. This represents bearish sentiment in the market.
Prediction of Short-Term Price Movements
If the number of buy orders decrease rapidly then it suggests a potential drop in the price. On the other hand if the number of sell orders decrease and the buy orders increase then it suggests surge in the price. So while keeping an eye on the order book we can come to know about the short term price movements as a trader.
Minimizing Slippage
The traders also use the order book to place limit orders at the suitable prices to avoid slippage while placing their order on the current market.
Spoofing
Large number of fake orders placed to manipulate the traders into the buying or selling of the assets at artificial prices. When a large selling or buying order from the order book disappears then it indicates a spoofing attempt in the market to trap the traders.
Order Book Trading vs. Traditional Technical Analysis
Here is a chart which displays the difference between the order book trading and traditional technical analysis:
| Feature | Order Book Trading | Technical Analysis |
|---|---|---|
| Data Used | Real-time market orders | Historical price and volume data |
| Focus | Liquidity, buy or sell pressure | Chart patterns and indicators |
| Best For | Short term trading such as scalping and day trading | Used for the mid to long term trading such as swing trading or long investments |
| Strength | Detects live market sentiment | Identifies long-term trends and key levels |
| Weakness | Can be misleading due to fake orders | May lag behind actual price movements |
From the above chart we can conclude that the scalper and day traders rely on the order book on the other hand if the trader wants to do swing trading or long term investment then the trader relies on the traditional technical analysis. But if we use the blend of both the things then we can get the best market understanding.
2️⃣ Question 2: Market Depth Analysis and Order Flow
Discuss how traders can use market depth to determine support and resistance levels. What insights can be gained from analyzing the order flow?
What is Market Depth?
Market depth refers to the volume of buy and sell orders at difference levels in Steem/USDT. It shows how much liquidity is available in the market. Market depth help the traders to asses the support and resistance levels. These levels are assessed on the basis of the concentration of the orders at a specific price level.
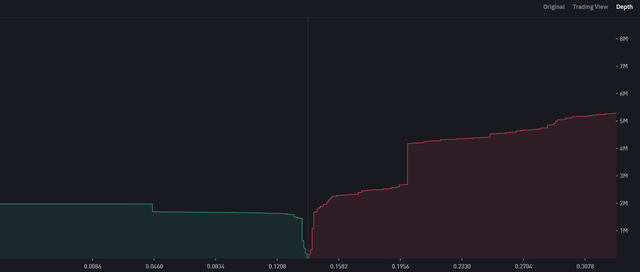
Understanding the Market Depth Chart
The market depth chart shows the total volume of the buy orders and sell orders at different price levels. These price levels are given below:
The green area in the order book is known as bid side. It represents the buy orders. These but orders are known as the support levels.
The red area on the order book is known as the ask side. It represents all the sell orders. The excess of these sell orders at a specific point is known as the resistance.
The middle area of the order book between the bid side and ask side is the spread of the market. It is actually the gap between the highest bid and lowest ask.
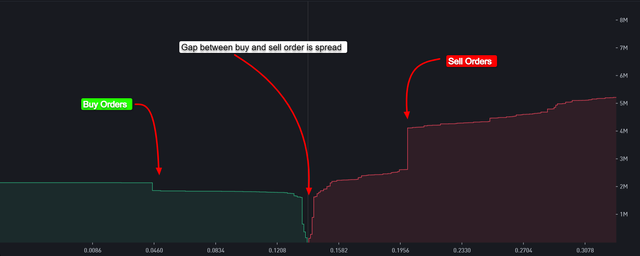
Here I have represented all the components of the depth chart.
How Market Depth Helps Identify Support & Resistance Levels
Here is the detail on how the traders can use the order book to identify the support and resistance zones in the market:
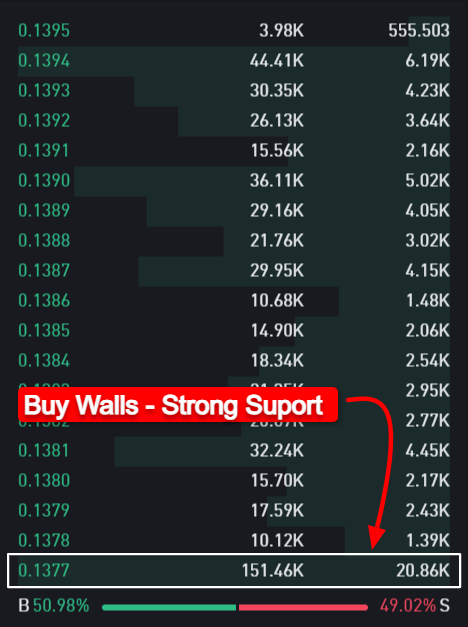
Identifying Strong Support Levels
As mentioned earlier the level at which there is the large accumulation of the buy orders is known as the support zone. At this zone the traders expect the price will bounce from this level in the upward direction when the price will reach this level. Because at this level the maximum number of orders will be placed and due to the increased demand the price will go upward. These are also known as the buy walls.
Example:
If there is a large buying order at the price of $0.1400 then it indicates that many traders are waiting to buy Steem at this price level. So if the price drops to $0.1400 it is possible that the this level will act as a support and the price will bounce from this level.
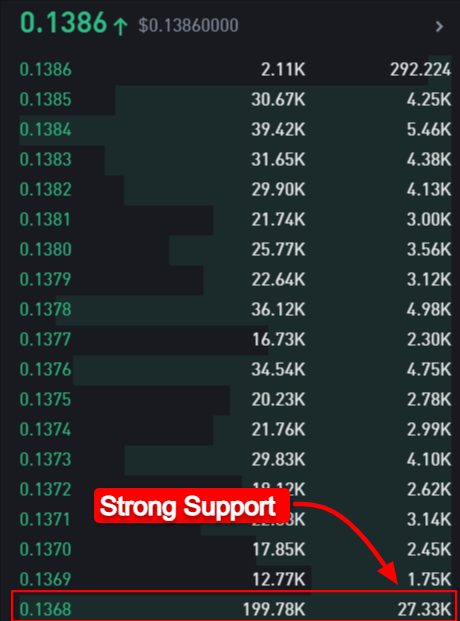
Here we can see the strong support where there are a number of buy orders at the price of $0.1368. The sum of the orders is to buy 199.78k STEEM at this price level with the USD value of 27.33k. So when these large number of orders will be executed the price will bounce back in the upward direction and it will act as a support.
Identifying Resistance Levels
This is against the support level. This is the level at which there is the large accumulation of the sell orders is spotted as the resistance zone. The price can struggle to break through these levels. This happens because at the resistance level there are the large number of selling orders and when those selling orders are placed at that price level then the demand of the asset is decreased and distribution happens. This is the reason that the price often retests from the resistance zone. But it can also happen that there is a lot of buying pressure which can break the resistance as well.
Example:
In order to understand I am taking an example of the resistance zone. Let us suppose if there are a number of large sell orders at the price of $0.1500 then it suggests that many traders are waiting to sell their assets in this case Steem at this price level. This is known as the sell wall and it is possible for the price to retest itself before moving towards the next level. Due to these orders placement the price will drop.
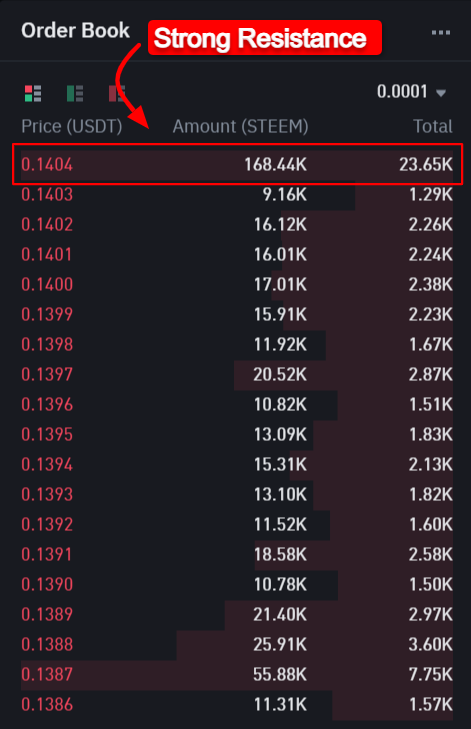
In this we can observe the strong resistance in the market. At the price level of $0.1404 there are many selling orders with the sum of 168.44k STEEM with the $23.65k worth. When the price will reach at this level due to the execution of the large number of selling orders the price will be rejected by this resistance.
Fake Walls & Spoofing (Market Manipulation)
Sometimes market manipulation or in other words fake walls or spoofing can happen. Some people to trap the traders place the orders artificially. These can be fake large buying or selling orders. The main purpose of these fake orders is to trap and trick the retailers to stuck their money in the market. In the order book if a large order suddenly disappears then it represents fake liquidity in the market. This is known as spoofing.
To identify the fake walls we need to be vigilant to look for the sudden removal of placements of the large orders before their execution. We should watch for the disproportionate order sizes that do not matches with the normal trading behaviour.
Understanding Order Flow & How It Provides Trading Insights
The order flow is the flow of the real-time buying and selling transactions which are executed on the exchange. It helps the traders to understand different things such as who is in control the buyers or the sellers. It tells the traders when they should enter or exit their trades. It guides the traders about the execution of the orders at large scale and at low scale.

This is the flow of the orders in the percentage. It shows the percentage of the buy orders and sell orders. In this picture the green bar represents the percentage of the buy orders and the red bar represents the flow of the sell orders in the market. Currently the flow of the buying orders is greater than the flow of the sell orders.

This is the real-time flow of the orders placed in the market. It changes everytime as the new orders are placed. We can know the number of the buy and sell orders with the amount of the STEEM used to place the order.
Key Insights
Here are the key insights gained from the order flow:
Detecting Buying & Selling Pressure
In the order book if the buy orders are consistently higher than the sell orders then it indicates bullish momentum in the market. It is a green signal to buy the assets or take a long entry in the market.
Similarly if the selling orders are higher than the buying orders then it recommends bearish momentum in the market. The trader can consider selling their assets in this situation.
The large orders which are being executed in one direction shows the strength of the trend in which the orders are being placed.
Example:
If large number of buy orders for Steem/USDT are executed at the price $0.1450 then it indicates strong demand of Steem. It is possible that the price will continue to rise in the upward direction.
Spotting Reversals & Breakouts
Order flow in the order book also helps to identify the reversals in the market. If the buyers suddenly absorb the sell orders then it is possible that a breakout will occur. On the other hand if the sellers become dominant on the buyers at the resistance level then it is possible that a reversal in the market will happen.
Example:
If Steem is trading at the price of $0.1455 and the buy orders are filling quickly then it suggests that the buyers are absorbing the sell pressure of Steem. It increases the chances of the breakout above the $0.1460.
Liquidity Tests
When in the market a large order is placed it helps to test the strength of the market. If a large selling order is absorbed by the buyers without the drop in the price then it signals strong buying pressure in the market. Similarly if a large buy order is absorbed by the sellers the nit suggests the strong selling pressure in the market.
Example:
If a trader places a sell order of 5,000 STEEM at the price of $0.1460 and if the order is absorbed suddenly then it means the buyers are willing to buy aggressively. It suggests that the price will increase.
Watching for Momentum Shifts
The flow of the orders is also helpful for the determination of the momentum shift. If suddenly a large number of selling orders appear in the market then it indicates panic selling by traders.
On the other hand if the buy orders increase in the market quickly then it suggests fear of missing out. In this situation it is possible that the price will go in the upward direction.
Example:
In the order book of Steem/USDT if the flow of the orders show the rapid selling but without significant buy orders then it suggests that the price will drop further. SO we can understand the upcoming momentum of the market.
So the market depth helps to identify the support and resistance levels. Order flow is helpful to understand the real-time buy and sell orders.
3️⃣ Question 3: Identifying and Reacting to Large Orders
How do large buy and sell orders influence the market? How can traders react to "whale orders" to optimize their trading strategies?
Large buy and sell orders are often placed by the whales. These whales may be the institutional traders or the individuals which have high worth. These big orders by these whales impact the the dynamics of the market by creating hype of the trend. These orders impact the liquidity and movements of the price.
Large Buy Orders
When a big buy orders appears in the order book then it creates a strong support at that price level. Many traders think that the price will stay above that price level. It creates a hype in the market among the traders and they rush to buy the assets. So this attracts ore buyers and in this way the price is pushed higher in the upward direction.
Large Sell Orders
When there is a big sell order it acts as a resistance. Many traders assume that the price will struggle to break above that price level where the large orders are being placed. It can also cause to trigger panic selling in the market and it leads the price to move downward.
Warning
Some large orders are spoofed and they cause fake liquidity in the market. These fake large orders try to manipulate the market. The traders should be very careful that these orders can disappear. They should keep an eye if these orders are really executed or they disappear before their execution. So if the orders disappear before their execution then do not follow those large orders.
How to Identify Large Whale Orders?
Many of us often remains confuse to identify the large orders placed by the whales. I will try to explain it in the simple words so that everyone can understand to identify the large orders placed by the whales.
- The traders should look for the unusual large orders in the buy and sell columns of the order book.
- They should compare these values with the normal or average buy or sell orders.
Example:
Let us suppose that the average order size for Steem/USDT is 500 to 1000 STEEM. And suddenly a large but order great than average size appears such as 10,000 STEEM buy orders at the price of $0.1400. This is possible that this is a whale order. This large order by the whale creates a support.
The large orders can also be spotted by watching the depth of the market. The buy walls represent the string support. These are indicated by the large green spikes. The sell walls indicate the strong resistance in the market. These are denoted by the large red spikes.
The tracking of the flow of the order with respect time and sales also help to determine if the large orders are actually getting filled or just they are acting as bait. The time and sales window shows the number of units being executed in real time.
Example:
If there is a 10,000 STEEM sell order at the price of $0.1500 and it is getting slowly absorbed then it suggests a strong buying pressure in the market.
On the other hand if this big order remains untouched then the traders should become vigilant and cautious about the reversal of the price.
How Traders Can React to Large Orders
Here are different aspects for a trader to react with the large orders:
Trading with Buy Walls (Bullish Strategy)
When a whale places large order to buy Steem or any other coin then psychology it creates a support in the market.
So when this opportunity appears in the market that a whale places a large but order then the traders can enter long positions. They should remain just above the buy wall for the low risk entries.
Example Strategy:
In the order book a buy order of 15,000 STEEM appears at the price of $0.1380. Seeing this large order the other traders start placing more buy orders but a little higher than this price such as at $0.1385. The trader can enter a long position at $13.86 with the stop loss of $0.1375.
Trading with Sell Walls (Bearish Strategy)
If a big sell order appears in the market it creates a psychological resistance. The traders especially the scalpers and short term traders sell their assets near the resistance before the price is rejected by the resistance of large selling order.
Example Strategy:
I'm the order book a 12,000 STEEM sell order is placed at the price of $0.1480. Currently the price is $0.1475 and the sellers are placing more orders. The trader can enter a short position at $0.1478 with the stop loss at $0.1485. In this way if the large sell order is placed and the price reverses the trader will get profit.
Whale Manipulation
In the market some orders are placed to trick the traders and these orders disappear before their execution. If a sell wall at $0.1500 suddenly vanishes then it is possible that the price will break out above this level. So do not be trapped in the fake orders.
Example Strategy:
The trader waits to see if the large order disappears from the market before entering the position. If the sell wall at $0.1500 is removed then the traders can enter a long trade while expecting a breakout in the price.
The whales also follow the strategy to distribute their money into a number of small orders. They place small orders every second. The traders should also follow their strategy and they should accumulate assets before the rise of the price.
So we can say that the large buy order create support and the large sell orders create resistance. The traders should watch the large orders if they execute or disappear to detect the fake walls. The traders can do long trades with the buy walls and similarly short trades on the sell walls. The traders should follow the smart money distribution by following the whales. The traders should use the order flow and the time and sale data to confirm the execution of the orders.
4️⃣ Question 4: Order Book-Based Trading Strategy
Develop a step-by-step order book trading strategy for Steem/USDT, detailing entry and exit points, liquidity considerations, and risk management techniques.
The order book provides real-time supply and demand dynamics. It helps the traders to make good decisions. These are not like the traditional technical analysis which relies on the historical price data of the assets. The order book trading just focuses on the live liquidity of the market. It allows the traders to react quickly according to the market movements.
I will use Binance exchange for the design of this trading strategy as it provides real-time order book, trade history, and depth of the charts. It helps to identify the following elements of the market which are crucial for the execution of the successful trading strategy:
- Support and Resistance
- Liquidity
- Whale activity
Here is the overview of the trading strategy and in this strategy I will focus on the scalping and short term trades because the order book changes quickly in real-time market movements. So with the help of order book I will identify the following things:
- Entry and exit points
- Liquidity considerations
- Whale order reactions
- Risk management techniques
Step-by-Step Order Book Trading Strategy
Here is the complete step by step trading strategy by using order book:
Identification of Key Levels
In the first step we need to identify the key levels such as support and resistance levels. We should look on the large buy and sell orders. The large buy orders are support levels and the large sell orders are the resistance levels. If we want to take a long entry then we need to take support zone as entry zone and if we want to short the trade then we need to consider resistance as the entry zone.
 |  |
|---|---|
| Large Sell Order | Large Buy Order |
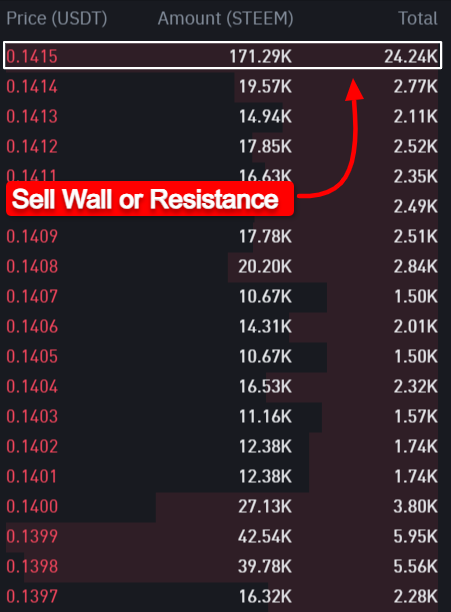
According to the order book data of Binance exchange the buy wall is at the price of $0.1377 because at this price the sum of the orders to buy STEEM is 151.46k with the worth of 20.86k USDT.
On the other hand the sell wall according to this data is at the price level of $0.1415 where there is the large selling order of 171.29k STEEM with the worth of 24.24k USDT.
Now we need to watch the large orders about their filling in the market. If the buy walls disappear in the market quickly then it means the buyers are aggressive and if the sell walls vanish then the sellers are weak and not confident about their orders.
Determination of Liquidity Zones
For the execution of the order in the trading strategy it is crucial to know about the liquidity zones in the market. We will determine the liquidity in the market with the he of the depth chart.
We know that if the gap between the buy and sell orders volume is narrow then it means the liquidity is high in the market. High liquidity in the market suggests easy execution of the orders whether they are buy order or sell orders.
Similarly if the spread is higher then it means there is low liquidity in the market. Low liquidity in the market suggests that it is difficult to execute the orders hence the trading will be difficult in this scenario.
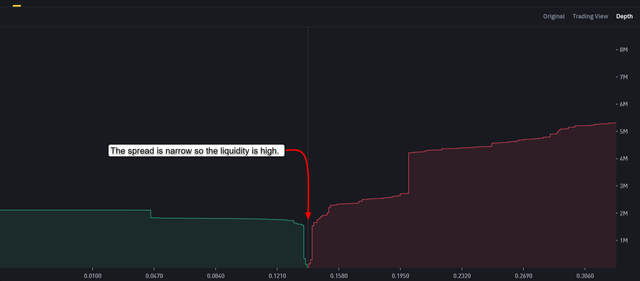
Here you can see the gap between the buy and sell orders is narrow so it means the liquidity in the market is high. This high liquidity in the market suggests that if we take any buy or sell trade we will be able to execute it easily.
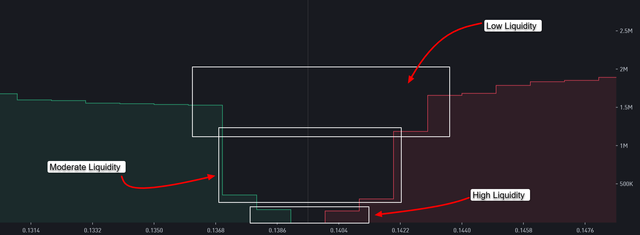
Here a the same time I have highlighted different liquidity zones in the market. The narrow spread has high liquidity in the market but with a few orders. On the other hand there are moderate and low liquidity zones.
In the high liquidity zone there are a few orders such as ranging from 43k STEEM as buy orders and 256K STEEM as sell orders. And in this area of high liquidity the market is moving swiftly and the orders are being placed and filled quickly.
How to Trade It:
We should look that if the price breaks out into a low liquidity zone with high momentum then the traders should enter the trade to ride the profit with the upcoming upward move due to high buy orders. The trader should also manage the risk by applying a top loss slightly below the entry level it will protect all the assets in the case of the failure of the breakout.
The trader should avoid trading in those areas where the liquidity is stacked heavily as the price can stuck in that range.
Watch Order Flow (Real-Time Trades)
In the 3rd step we need to follow the order flow chart which gives information about the real-time trades in the market. I will use Time and Sales or the trade history on binance to see the executed trades. If the large buy order gets executed then it confirms the strong demand of the assets. It gives a bullish signal in the market. If the large sell order are executed completely then it suggests the buyers are in the control.
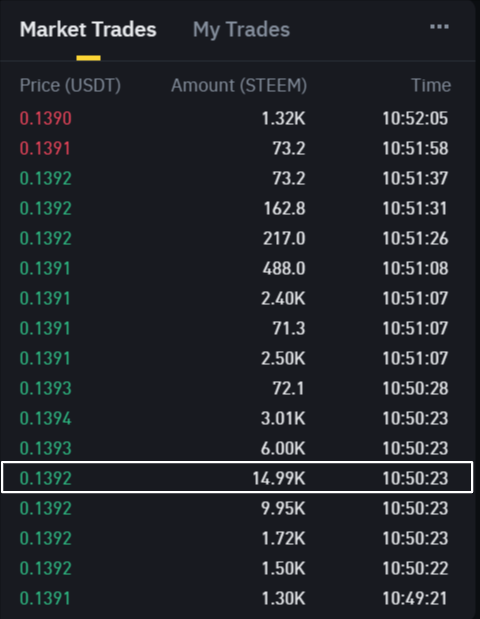
Here you can see the order flow and the time and sale history of the orders. We can see there are a lot of buy orders with the highest buy order of 14.99K STEEM. After this there are several more buy orders and it represents the potential buying zone for the upcoming price movement in the upward direction. There are some small orders as well but these small orders are fail to push the price in the downward direction.
Entry and Exit Strategy
Now in the 4th step after determining and seeing all the fundamentals of the order book and order flow we can move towards the entry and exit zones in the market.
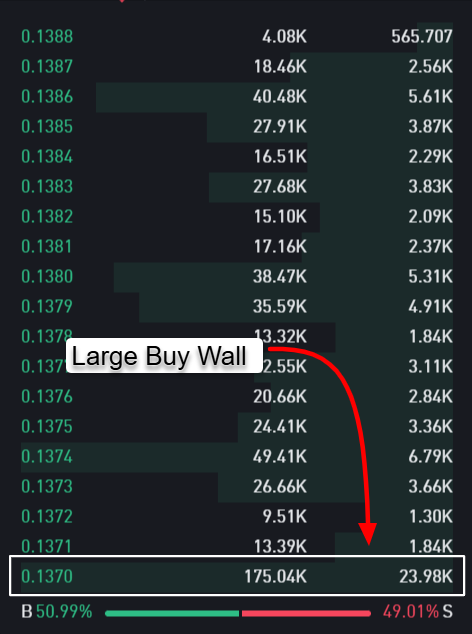
Here in the order book we can see that the large buy wall is at the price of $0.1370 and it is the string support zone. There is the collective buy order of more than 175k STEEM with the worth of $23.98K.
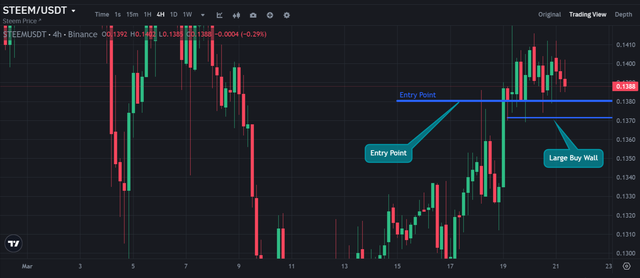
Here in the chart I have highlighted the large buy wall at the price level of $0.1370 as the large buy order is at this price level. To take a long entry in the market we need to place our buy order slightly higher than this large buy wall. Here our entry zone should be at the price between $0.1375 to $0.1380 for the successful placement and filling of the order.
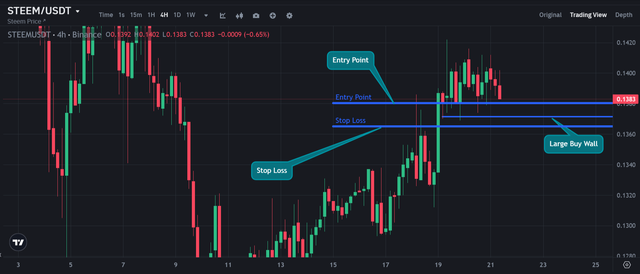
Risk management is really very important in trading. So in order to manage the risk in the trade I will continue to set stop loss for my trade to avoid unexpected loss because of the wrong movement of the market.
We need to place the stop loss slightly below the buy wall. The buy wall is at the price level of $0.1370 and I have placed my stop loss slightly below this buy wall at the price of $0.1365 in this way our trade will be exit with the loss of 1.24% instead of more loss.
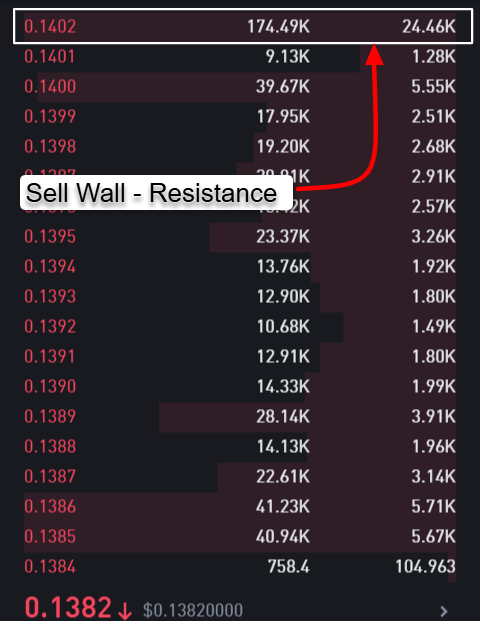
Here in order to set the stop take profit level for the trade we need to identify the resistance from the order book so that we can take profit at the resistance because it is most likely for the price to come down after hitting the resistance or sell level. The high resistance is at the price of $0.1402 and in this case I will set the take profit level for my trade at the price of $0.1400.

Here you can see I have set the take profit level near the resistance level. And if my take profit level is hit then I will take around 1.24% profit from this scalp trade with respect to the order book and order flow trading strategy.
Now if we want to place a short order in the market then we will follow the reverse long strategy and we will be able to place our short order in the market.
Managing Risk & Liquidity Considerations
In the order book trading strategy or any other risk management has key importance and we should also look the liquidity for the successful trading experience. Here are some tips and tricks to manage the risk in the trade and to consider the liquidity concentration in the market:
Never chase trades
Please always keep in mind that never chase any trade. If the price is moving too fast then do not rush in the trade without the confirmation but wait for the retracement in the price. After this retracement in the market take entry.
Avoid highly illiquid zones
Do not trade in the zones where the liquidity is very low or negligible because if you trade in these zones you can face the problem of slippage in the trade where your buying order price and selling order price has high price difference and you will face problems in trading and the order execution will also be very slow.
Use stop-loss orders
This is the quote of millions that always use stop loss in the trading strategy. Limit your downside risk especially when the trading volatility is high by placing stop loss.
Position sizing
While trading please use small size for each trade from your capital. If you use high position size then there is to risk of liquidation with great speed and you can loose your assets. So please keep trades small to avoid the liquidation risks. It is highly recommended when you are using leverage in your trade.
Always monitor the market conditions and the news events because the new events can cause imbalance in the order book and the price can spikes suddenly and so on.
5️⃣ Question 5: Real-World Order Book Case Study
Analyze a real or hypothetical order book trading scenario involving Steem/USDT. What key takeaways did the trader gain, and how did they adjust their strategy accordingly?
I will try to support order book trading with the help of a hypothetical scenario. Here is the overview of the scenario:
In this hypothetical scenario I am imagining myself as a trader. So I am Faisal as a trader, is actively scalping Steem/USDT using the analysis of order book. I monitor the sell walls, liquidity depth, and flow of the order on Binance.
Initial Market Conditions
Here is the detail of the initial market conditions:
- The current price of Steem is $0.1400.
- The buy wall of Steem is 150,000 STEEM at the price of $0.1385. This buy wall is acting as the strong support.
- The sell wall of Steem is 120,000 STEEM at the price of $0.1420. This sell wall acts as the strong resistance of Steem.
- The order flow shows that the large buy orders are executing frequently. And this suggests that the buyers are anirbing the selling pressure and the price will go in the upward direction.
Trade Execution
After identifying and determining the current market condition we can move towards the execution of the trade.
I observe that the buy wall at $0.1385 is holding tight and strong. And the sell wall at the price level of $0.1420 is being chipped away slowly. It indicates that the buyers are absorbing the sell orders.
Then I look at the trade history. Trade history of time and sales show the consistency of the large buy orders. It confirms the strong buying pressure.
So by seeing all the details of the order book and the flow of the orders execution I take the decision of long trade. I choose the entry price of $0.1390 for the long trade. And then I set up the stop loss level at $0.1375 below the buy wall to avoid loss and to manage the risk. I set the take profit level at the price of $0.1415 to $0.1420. My take profit levels are near the resistance.
Adjusting to Market Movements
Risk management and adaptation to the market both are the key tools to be a successful trader in the market.
The price of Steem roses $0.1412 and this level is near to approach the sell wall at $0.1420. but the problem is that another large sell order appears at the price of $0.1415 and now it becomes the recent resistance in the market.
In this scenario I adjust my trade by adjusting it's exit target to $0.1414 to lock the profits before the rejection by the strong new resistance.
By following this strategy for a hypothetical scenario here is the outcome:
- Entry: $0.1390
- Exit: $0.1414
- Profit: +1.72%
Key Takeaways & Lessons Learned
Here are the key takeaways and the lessons learned from this hypothetical trading scenario:
Liquidity Changes Quickly
The large orders in the market can appear and disappear quickly. So please keep it in mind to not blindly react to the buy or sell walls in the market. I monitored that real-time changes in the market and in that way I adjusted my trade by setting a new exit point.
Time & Sales Confirms Market Sentiment
The time and sales help us to confirm the sentiment of the market. When the large orders are executed successfully in the market we can confirm the direction of the trade. Buy walls or the sells walls are not enough for the confirmation of the trend but the we should check the orders if they are actually getting filled or not.
Adapt to Dynamic Market Conditions
Initially I planned to exit my entry at $0.1420. But when I saw the resistance at the price of $0.1415 I was forced to adjust my take profit or exit level according to this new resistance level. When we take small entries we can secure more profits. It is better than holding for a perfect target. We should adapt according to the market conditions.
If I conclude my hypothetical trading experience than I can say order book based strategy helped me in these ways:
- I was able to identify the strong support and resistance zones in the real-time data.
- I used order flow and market depth data to confirm the trend in the market.
- To adapt towards the market conditions I was able to adjust my targets dynamically on the basis of the new sell orders.
- I secured a good trade with the minimum risk.
Note: All the screenshots have been taken from Binance.
Thank you for sharing on steem! I'm witness fuli, and I've given you a free upvote. If you'd like to support me, please consider voting at https://steemitwallet.com/~witnesses 🌟
Greeting and Appreciation:
Hello, @mohammadfaisal! 🌟 I must say that your post on Steem/USDT order book trading is deeply nuanced. I appreciate your explanation of market depth, order flow, and liquidity strategies, and how you made them easier to understand. It's clear that a lot of effort went into crafting every section with examples and visuals, and I admire that!
Highlights of Strengths:
Clarity & Structure: Your trade strategy step and case study were explained in such detail that even a novice or an experienced trader would be able to follow along.
support/resistance and whale orders.
Risk Management Focus: Placing emphasis on stop-loss and position size control highlights an often neglected, yet essential, aspect of trading.
Key Takeaway for Me:
Your analysis of spoofing and fake liquidity was shocking. Remembering to check the order book against trade execution (time/sale) data before reacting is something I will work to incorporate into my own plans.
Questions for Discussion:
What would you suggest in terms of distinguishing between genuine whale activity and widespread spoofing in fully volatile markets when orders seem to rapidly appear and disappear? Do you have go-to indicators or tools you use for confirmation?
Follow-up contribution to automation Orderbook analysis (for example, tradebots and large order warnings) is attractive! Many dealers need to address surveillance in real time, and that discovery could fill this gap.
Another great job! Your contribution is a gold mine for Steem/USDT and anyone who wants to act strategically. Good luck in the competition, you're expensive! ð
I also participated in this competition. You can go to my account and see my contributions.
You need a lot of hard work please do not move a move that is embarrassing for you and prevents you from growing up. **Cc, @steemcurator01 and @steemcurator02
0.00 SBD,
0.01 STEEM,
0.01 SP
😂 Good Job @shabbir86 as soon as I saw this reply I was surprised to see an AI comment but I was silent to wait and watch what this guy does. This does not even have any introduction post and just making noise with AI.
@sun-developer who invited you?
It is surprising that he did not apply his intermediate post and did not get verified, but he started scoring the scars.
I think this is @dev-pro with this new account.
I don't know @dev-pro and dev-pro not invited me.
@mohammadfaisal I hope you are well and are breaking the fast of Ramadan at this time.
All the posts I have made on this account of mine are AI and Plagiarism.But that comment was really wrong with me, I apologize for it, I was watching Mistake.
You took the time and gave me an answer, I am grateful to you for this, I will do my verification soon, but it may take some time.But I will never try to break the rolls of Steemit.
I will try blindly not to make any mistakes in my content.
My question how many time I write steemit learning challenge post in one week.
@shabbir86
I really want to apologize for that. I was checking for mistakes, so it was mistakenly commented on by me. My RC credit is low right now. When it is higher, I will change this comment.
I won't make a mistake like that again. In fact, I was just thinking about the mistake I made and I tried really hard to edit the comment but I couldn't.
If you want to make a change, the comments -up that has made me a comment on the comments -up can again do it again with your honesty but you have just commented me
@shabbir86
Thank you for your feedback.
It was really my mistake. I wanted to check the mistake, so it was posted by mistake. For that, I apologized before and I apologize now. You can check again. I have fixed it. You can change your comment.
If honest people like you work on Steemit, then mistakes will really be corrected automatically.