#Repost Steemit Crypto Academy Season 3 Week 2 by professor @reminiscence01Beginner's Course Introduction to Charts
Explain the Japanese Candlestick Chart? (Chart screenshot required)
Before diving into explaining what Japanese charts are I would like to analyze some important points about trading charts and where they can be used and found in exchange or crypto trading space.
Ideally, charts form simple basics for all trading activities which means without a basic idea about charts it can be somewhat difficult for any trader to understand market trending movement.
Charts will are sometimes referred to as basic key factors for understanding trading, an interested trader needs to understand before diving into trading with a chart a trader can know simple market open and close when to open and close trade also importantly with a chart a trader can track or trace trading history to know how the market, has behaved in the previous year or months and week.
in general, the trading chart represents a historical background of all trading activities and serves as a graphical representation for all trading activities such as making simple entry and closure of trading activities by traders or experts
Types of charts in trading
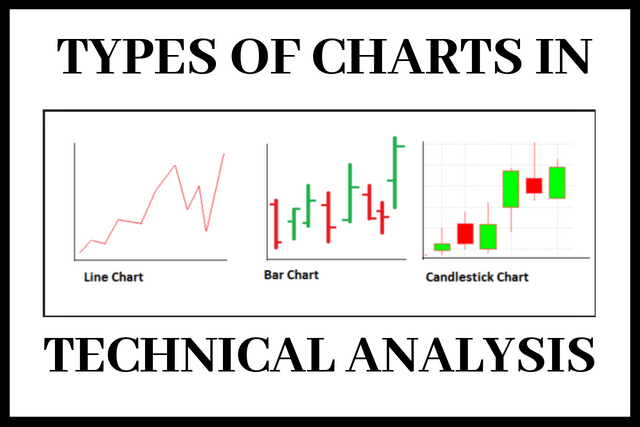
source
Above are the three types of charts used in the trading #line chart #bar chart and #candlestick chart.
Candlestick chart is the most popularly used chart traders as it gives a more simple view of market trend movement.
In trading, charts can be used in spot market trading where traders can compare different pairs of coins before, buying, or selling charts are also used in future and option trading for long-term trading.
Importantly Charts help guide traders to conduct simple and complex trading activities keeps them informed of basic market trends such as when the market will bull or bear.
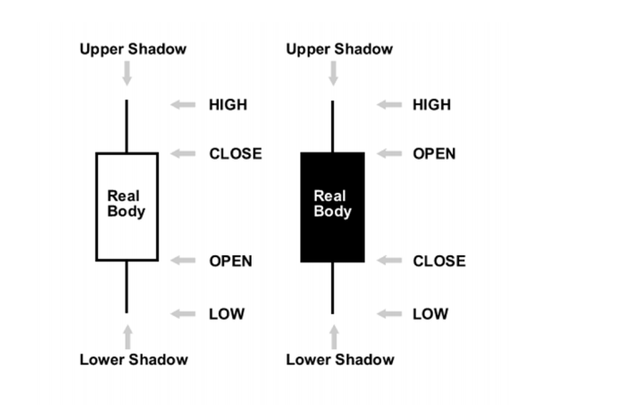
Japanese candlestick chart
source
Steve Nison discovered the Japanese candlestick secret which he learned from a Japanese expert that uses the candlestick to trade rice.
Candlestick in trading are used to describe price action in trades such as highs and lows, open and close using various time frames base on a choice it can be used base on one day, hours, and minutes.
Candlestick can be represented base on two market movements either a bear market or bull market.
From the above screenshot, the candlestick on white represents a bull market while that on black represents a bear market.
Candlesticks anatomy
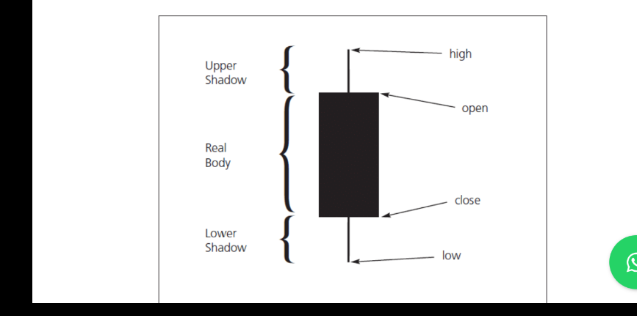
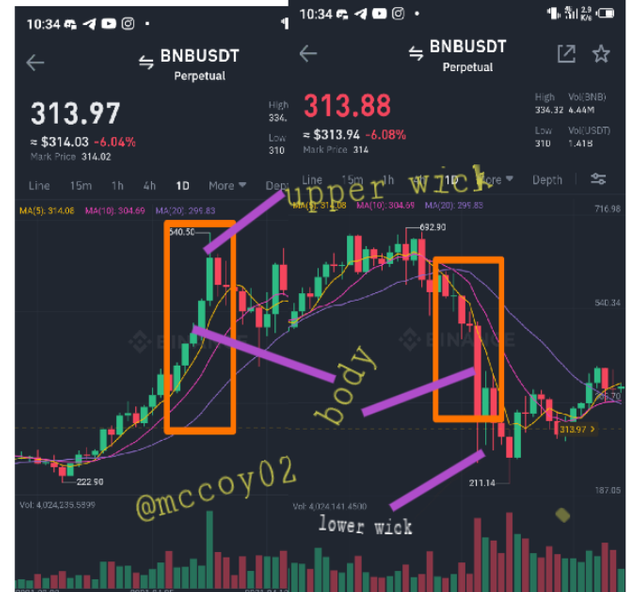
Upper shadow; can also be referred to as the upper wick this part represents the high price action of the day.
Lower shadow; also known as the lower wick it represents the lower low price of the day and it's the difference between the bottom and the real body.
Real body; represents a rectangular part of the chart it's the real part of the chart indicating real price action.
Advantages of using candlestick
Graphical representation; with candlestick chart traders can easily view graphical views of all trading activities such as viewing various price actions of different time frames.
Easy to understand; candlestick chart helps users/traders to easily understand how to complete simple trading tasks such as opening and closing time of the trade.
Records; a trader can view different time frames in trading and also trace different time zone histories of previous trades.
Describe any other two types of charts? (Screenshot required)
Other types of charts include
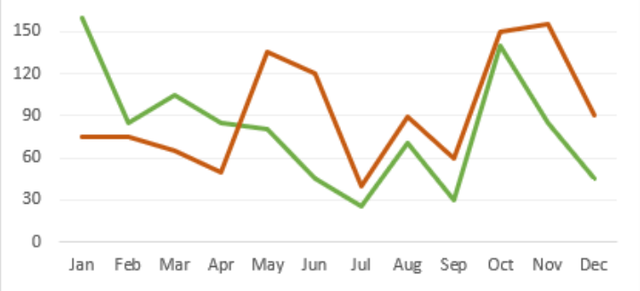
- Line charts an important advantage of using a line chart is it eliminates unnecessary trading emotions which means it saves a trader the stress of observing market highs and lows.
Line charts are used mostly by stock traders, can also be used by day traders for making quick technical analysis line charts display only the closing price of the market action.
The line chart is used mostly by broadcast networks because it is easy to understand and digest.
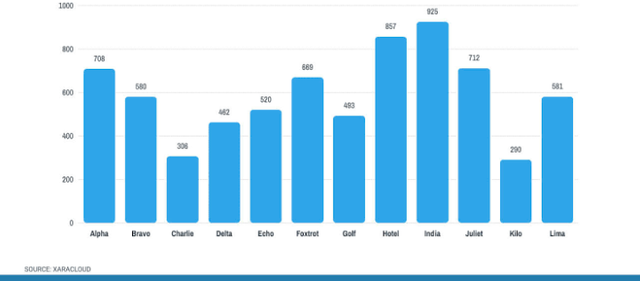
- Bar chart this chart provides a trader more detailed analysis like closing and opening price shows support and resistance for making proper technical analysis.
Bar charts can be used in forex trading for stock, commodities, and indices.
In your own words, explain why the Japanese Candlestick chart is mostly used by traders.
The Japanese candlestick is preferably used by traders because it gives traders more detailed information on market price action. having 3 interesting parts such as high wick which gives detail on high price reached in 24hr, weeks or months, and low wick which gives the lowest price with these features contained in a Japanese candlestick a trader can precisely understand how the market moves base on price closure and opening.
Also, the Japanese candlestick helps traders to conduct convenient technical trading analysis helps to easily indicate or locate market support and resistance with we'll visible views of market trends action.
Describe a bullish candle and a bearish candle identifying its anatomy? (Screenshot is required)
source
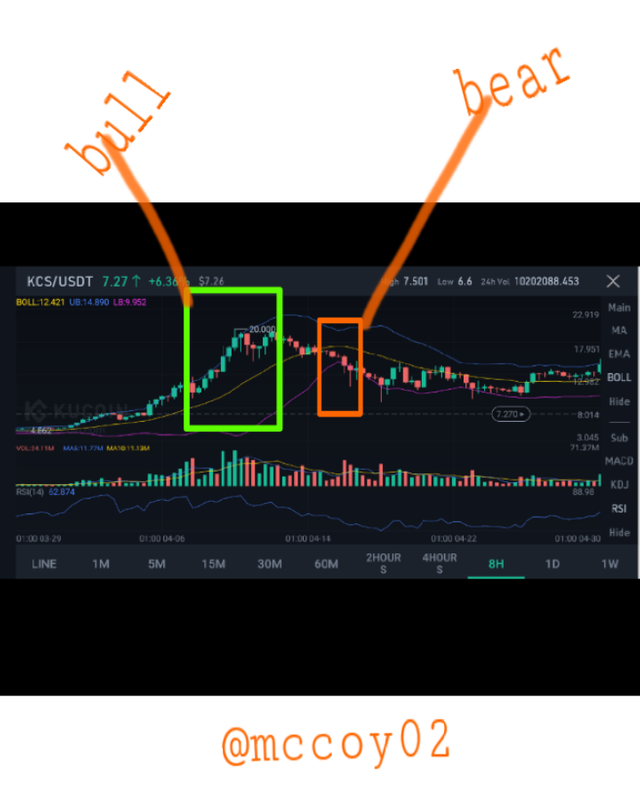
Above is a kcs/usdt pair showing a market bull in the light green rectangle indicating a rise in the price of KSC.
source
The rectangular red box indicates a bear market in the price of KCS showing a reduction in the price of the kcs token.
The above screenshot also shows the anatomy of a candlestick from the binance trading app of BNB/USDT.
Conclusion
Charts Candlestick are primary indicators traders rely on to get information from market price action the Japanese candlestick is very important and easy to understand as it gives more detailed information on market price as a trader who has an interest in trading understanding charts analysis will help in developing good market entry trading.
Hi my post was graded 7 with no upvotes below is proof of screenshot from my grade.
below is the link to the previous post
https://steemit.com/hive-108451/@mccoy02/steemit-crypto-academy-season-3-week-2-by-professor-reminiscence01beginner-s-course-introduction-to-charts