Crypto Trading with Volume Indicator || Crypto Academy S4W2 || Professor @kouba01
"Trading is not for the dabblers, the dreamers, or the desperate. It requires, above all, one steadfast trait of dedication. So if you are going to trade, trade like you mean it."
Rod Casilli

Image edited with PicsArt
Crypto Trading with Volume Indicator || Crypto Academy S4W2 || Professor @kouba01

Explain the volume indicator in your own words
The volume of an asset's price chart is a measure of the amount of the asset that has been bought and sold over a period of time. In other words, on a chart, for example of the Ethereum price, the volume is the number of Ethereum that have been bought and sold during the defined time of each candle.
Each price candle will have a bar with the volume associated with that candle, and where a green bar will indicate that the closing price in a given period is higher than the previous one, and red that the closing price in that period is lower. In addition, depending on the degree of the volume, it will indicate a greater pressure with respect to the direction of the trend in which it is located.
For example, in the following Ethereum - USDT chart from Trading View using the Binance exchange to obtain the data, we can see how the volume increases in an uptrend, these are the bars at the bottom associated with each candle.
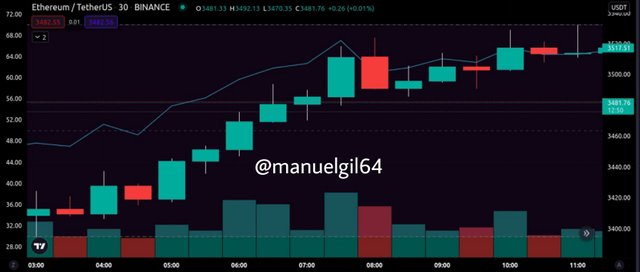
So we can by analyzing the patterns regarding the amount of volume such that: an increase in price with an increase in volume is a strong bullish signal. While a price increase with low volume is a sign that it may not have continuity.
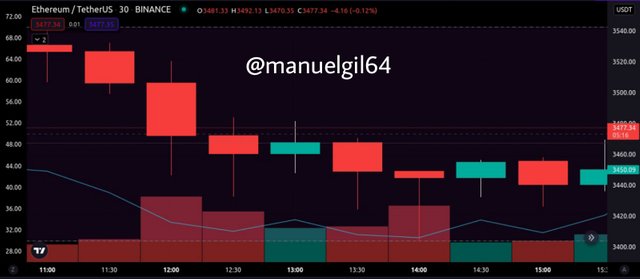
The same for a downtrend, where a decrease in price with an increase in volume is a strong bearish signal, and with a low volume it is a signal that it may not have continuity.
Again in the following Ethereum - USDT chart we can see the increase in volume as a sign of a strong downtrend.
Use a platform other than Tradingview to present the volume indicator on a chart and show how to configure its parameters by justifying your choices
Next we will use Binance to set the volume indicator on a chart, in particular we look at the chart of Cardano versus USD Tether (ADA-USDT). By default the volume indicator is shown below the main graph, then we will click on the slot to configure the index.
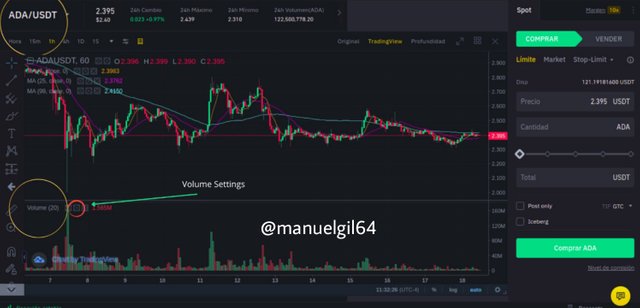
We are going to configure the time period in each candle instead of 1 hour for 4 hours, and then we will modify the data inputs which we will consider marking the MA to obtain the average moving average of the previous 20 bars, which we also consider for configuration.
In this way, with the MA we can obtain more information about the pressure of the market trends in volume average, and see the difference with those bars that are out of the average, that some of these bars that present a greater difference with respect to the MA are those that are approaching resistance or supports, where traders have a greater point of interest in making an entry or exit.
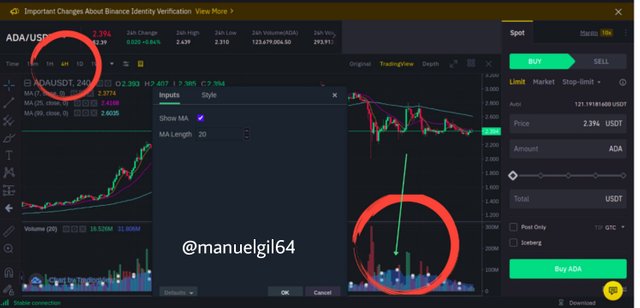
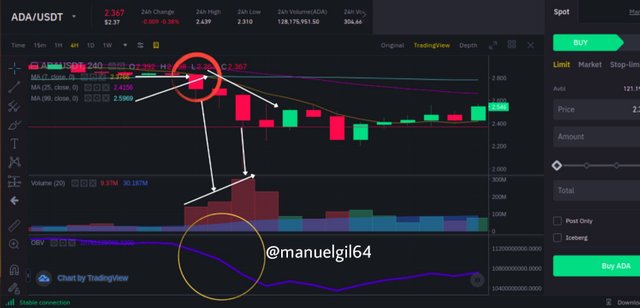
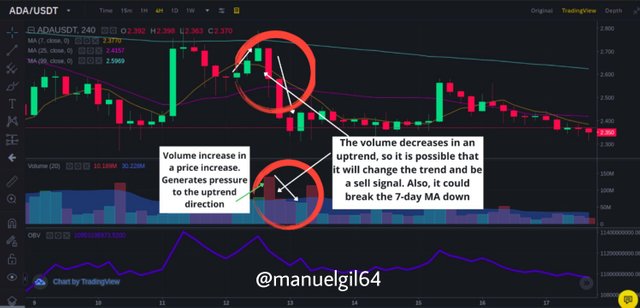
In the following image you can see just the change in the 99-day MA and the 7-day MA cross, there is just a large increase in volume causing a large decrease in price, and therefore, this large increase in volume has a large difference with respect to the volume MA that we just configured. In the next point we will explain this in a little more detail.
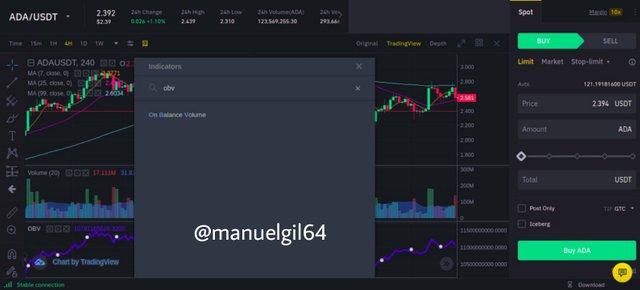
Finally we are going to add another volume indicator, in this case it will be the On Balance Volume (OBV), for this we go to the technical indicators option, we look for the name and add it.
What is the link between Volume and Trend and how to use volume to predict a trend reversal?
As we already mentioned in point number 2, when analyzing ADA - USDT in 4-hour candles, just when the 7-day MA and 99-day MA intersect, there is a large decline in the price of Cardano, but also a large increase in the price of Cardano volume. What does this mean or what is the volume? That the increase in volume indicates an increase in market pressure, in this case of many sales movements, it gives a greater push to the trend that is being generated, which is a downward trend.
Below we can see the OBV indicator, which also falls considerably, this means and confirms that there is a strong downtrend. In this way, the volume is linked to the price of an asset, and allows us to obtain more information about what is happening and what could happen.
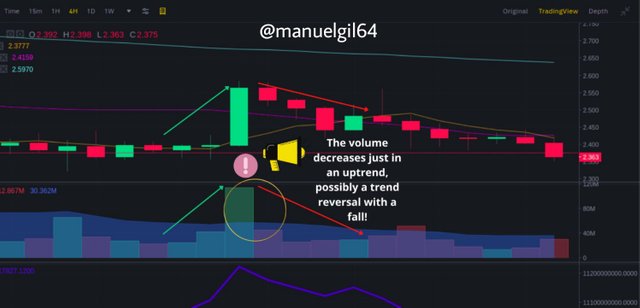
In addition, the volume can help us to predict a change in trend, in the following example in the image below we can see how the volume increases in an upward trend, pressing said direction in the market, however, then the volume decreases, which It could serve to suppose that a change in trend is possible, which actually occurs by generating a fall in price.
Source
How to use the volume to have a signal confirmation?
As the volume indicator has a very important link with the price of an asset, in addition to indicating possible changes in trends, we can also use it to confirm entry or exit signals.
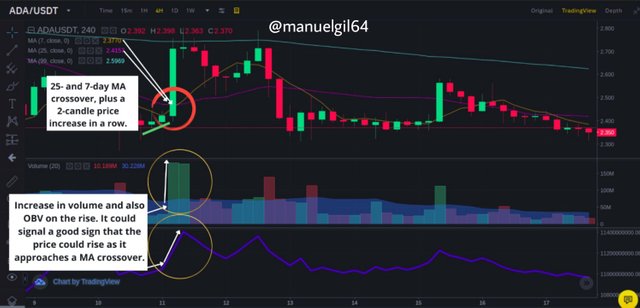
In the following image we can see an example, where there is an uptrend with an increase in volume that is approaching the crossing of the 25 and 7-day MA. Is it possible to break up? Additionally, the OBV indicates an increase, so just at that point it could be an entry signal since the price could shoot up.
Another example in the following image is an exit signal after an upward trend, as we had already mentioned before, with the volume we could predict possible changes in trend, and then we can see that after an upward trend with an increase in volume, we are presented with a drop in volume, which makes us suspect that a change from an uptrend to a bearish trend is possible, and that it may be a timely sell signal.
How does the volume reflect the evolution of prices in the charts and why does the volume sometimes anticipate the price?
The volume can be reflected in different ways in the evolution of the price of an asset, in the following image we are going to observe some cases of this and how it can sometimes be anticipated in the price.
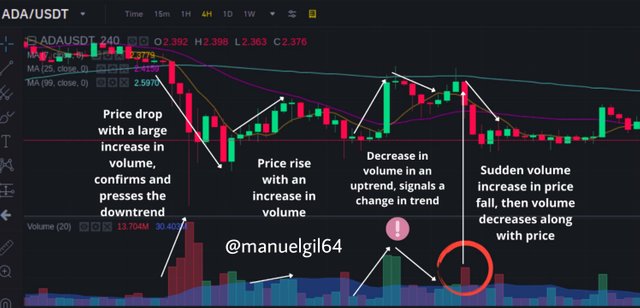
In the first case, the volume increases as the price falls, this generates pressure in the direction of the trend, confirming the downtrend.
The analogous case is the following, where there is an increase in volume in an uptrend. Later it happens that there is an increase in volume in an uptrend, then, the volume falls, giving an early signal about the change in trend and that the price could decrease, and that in effect, later the price begins to fall.
Finally we can observe a peak case, where there is a sharp increase in volume in a fall after an uptrend, this is due to a refusal to break the resistance of the 99-day MA.
Is it better to use the volume indicator alone or use it in parallel with another indicator when trading?
Every good trader knows that it is never a good idea to use only one indicator in technical analysis, and that it is useful to use other complementary indicators that can provide us with more information.
Since using a single indicator could launch false positives, and the more indicators we can use, the greater context of the situation we can have to draw conclusions.
In the following example we are going to use the Relative Strength Index (RSI) in complement with the volume indicator. Basically the RSI in summary tells us that between a scale of 1 to 100, if the index is below 30, then the market is oversold, and on the other hand above 70, then overbought.
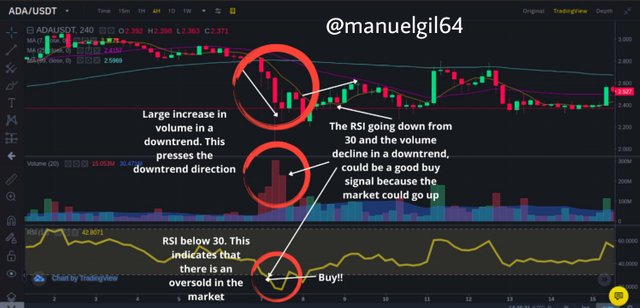
In this example we can see how in a large downtrend, confirmed by a high volume that presses that direction and well above the volume MA (the blue shading that can be seen in the volume bars), when the RSI passes below 30, this gives us a signal that the market is oversold, which we can suspect could be a buy signal, and that indeed, as the volume begins to decrease in a downtrend, we can see that it could happen a change in trend.
With this information we could consider a good market entry signal.
The volume indicators are multiple, choose one of them to briefly explain its usefulness in crypto trading
By definition the Volume Oscillator shows the difference between two moving averages. The difference can be expressed in points or percentages and in this way determine if the total volume of the trend is increasing or decreasing.
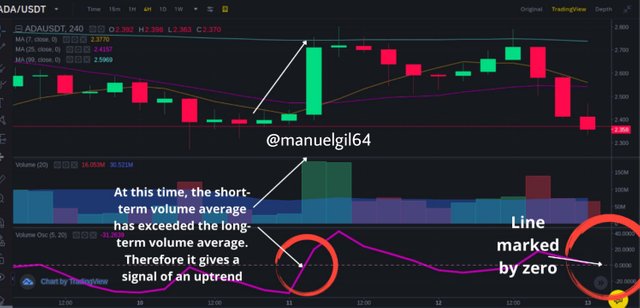
For example, when the Volume Oscillator crosses above zero, this indicates that the average of the short-term volume has crossed up the average of the long-term volume, and in this way, it marks the trend of the volume in the short term. term is greater than the volume trend in the long term.
In the example below we will consider the 5 volume bars as short term and 10 as long.
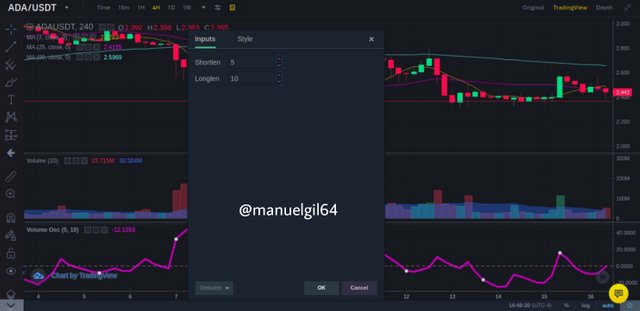
In the image below we can see at a time when the Volume Oscillation exceeds the line marked by zero, indicating that at that time the short-term average has a greater volume than the long-term average that we consider in the configuration. And in this way it indicates an uptrend.
In this example, in fact, the price increase is a lot, even in the volume indicator above the increase is also very significant.
Conclusions
The volume indicator is quite an important indicator in technical analysis, so important that it comes by default when viewing a chart of an asset.
The price graph is very complementary to know the market context, however, it must always be complemented with other indicators to carry out good estimates or projections of the asset price. In addition to having additional information such as the MA of the volume, other indicators such as OBV or Volume Oscillation that allows us to bring more information.
With the volume indicator we could detect and project trend changes, or confirm the direction of the current trend, and see the behavior and evolution of an asset over a period of time.
Knowing the volume is so important that there are classifications such as the top of the cryptocurrencies with the highest volume movement for a period of time that Coingecko or Coinmarketcap has. In addition to the amount of daily volumes that an asset has, it serves to generate confidence in the project, that is: The greater the volume of trading an asset has, it could be considered that there are many investors and therefore it could be an interesting project to study and analyze possible investments.
This is my Homework Post for Crypto Trading with Volume Indicator || Crypto Academy S4W2 || Professor @kouba01


twitter-promotion
#promo-steem
Hello @manuelgil64,
Thank you for participating in the 2nd Week Crypto Course in its 4th season and for your efforts to complete the suggested tasks, you deserve a Total|6/10 rating, according to the following scale:
My review :
Work with acceptable content. It was possible to go deeper into the ideas presented and provide several examples. Here are some notes that I bring to you.
Your explanation of the volume indicator was brief and did not highlight its most important characteristics.
As for the second question, you did not justify your choice of settings.
You did not provide a deep explanation of the indicator's relationship to the trend and its repercussions, and the same for confirming the signals.
The rest of the questions and I was somewhat satisfied with your answer.
Thanks again for your effort, and we look forward to reading your next work.
Sincerely,@kouba01
Thank you Professor for your feedback
Congratulations, your post has been upvoted by @dsc-r2cornell, which is the curating account for @R2cornell's Discord Community.
Enhorabuena, su "post" ha sido "up-voted" por @dsc-r2cornell, que es la "cuenta curating" de la Comunidad de la Discordia de @R2cornell.
Thanks a lot for your support!