Crypto Academy Season 3 | Intermediate Course: Crypto Assets and the Random Index (KDJ) by @g0h4mroot by the cryptoprofesor @asaj
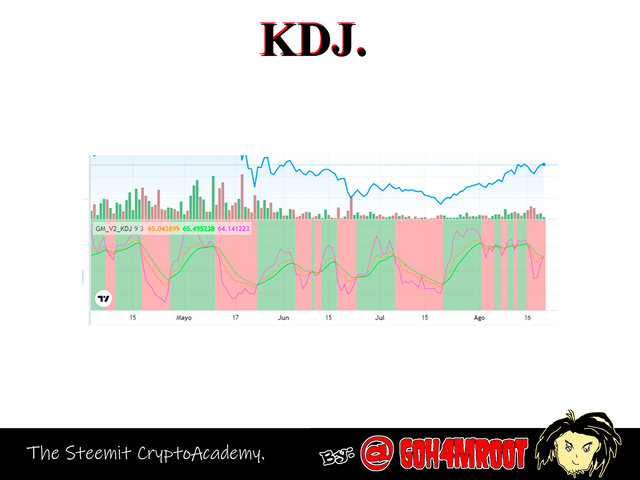

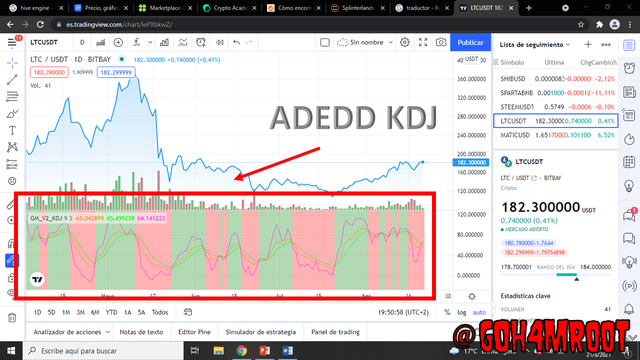
The random index or KDJ is an oscillator-type indicator that has been in the market for a short time, it is created and thought under stochastic parameters to be very similar to it, these 3 lines facilitate the study of an asset when analyzing the
market technically and helps us monitor market trends, establish entry and exit positions, it is mainly used for long periods of time and it is perfect for knowing when there is overbought and oversold.
The calculation of the KDJ oscillator is a bit complex, in the same way I will try to calculate it in the best way.
for this we use the following equation:
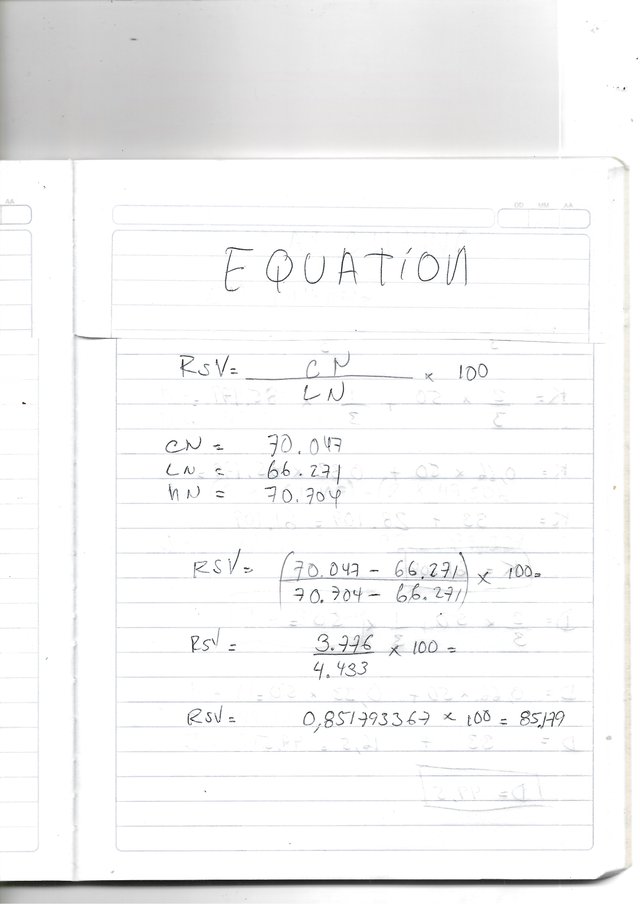
N day RSV = (CN - LN) = (hn - LN) x 100
cn is equal to the daily closing price; In the L it is the lowest price; hn is the highest price for date N.
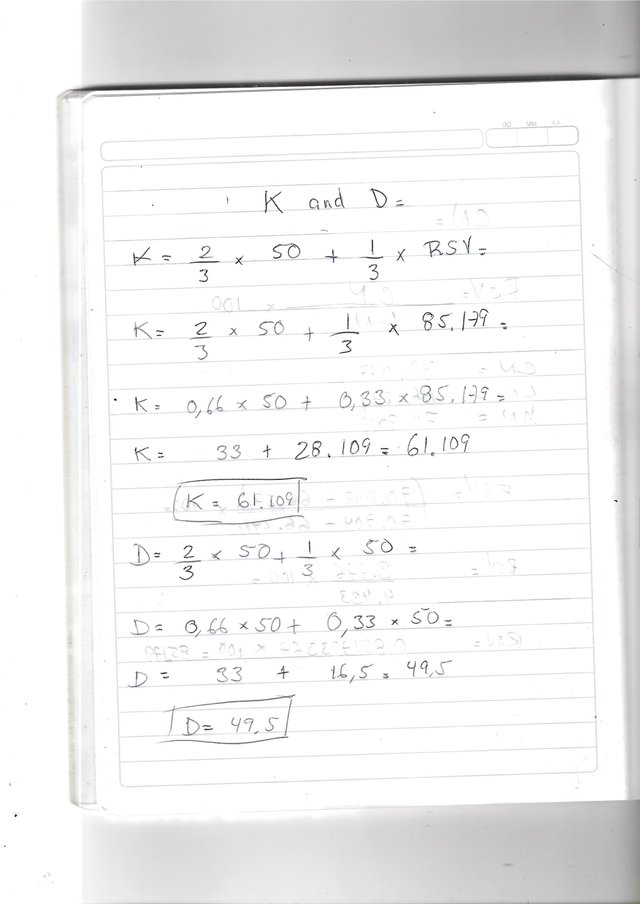
for K and D:
K = 2/3 x k the day before + 1/3 x RSV of the day
D = 2/3 x d the day before + 1/3 x k the day before
If we do not have the K-D values of the previous day, we substitute them for 50.
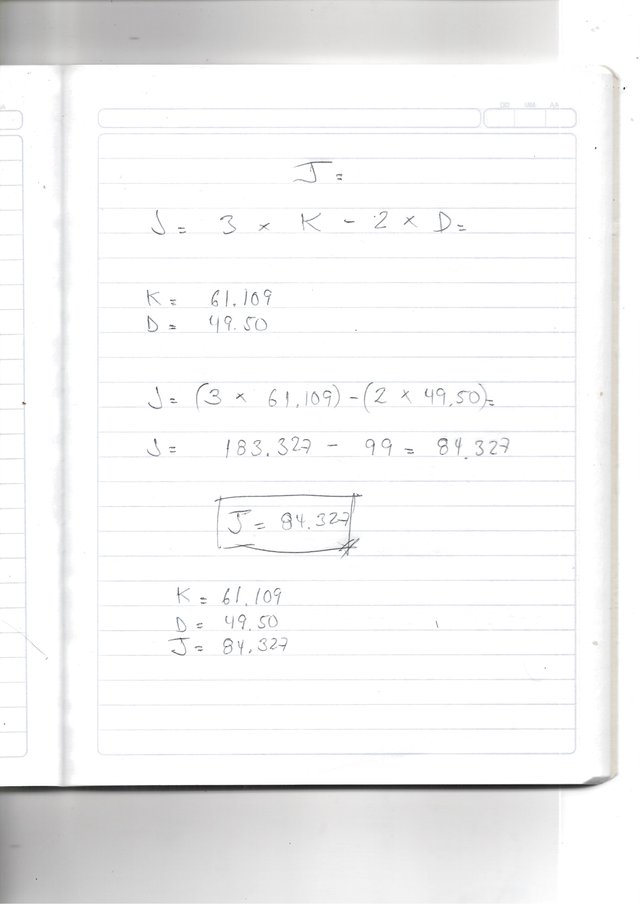
J value = 3 * K - 2 * D
Using the ETC values we are going to calculate the KDJ.
- the closing value of the previous day was: $ 70,047
- the previous highest value was $ 70,704
- the lowest value was $ 66,271
we proceed to calculate our KDJ.

2- Is the random index reliable? Explain
Like any indicator, it is not 100% reliable and this particular tool is rumored to give a lot of false signals in short periods and sometimes shows that the market is lateralizing when it is not, as each tool should not be used individually to get good results. results. . results. . be combined with other indicators.
3- How is the random index added to a chart and what are the recommended parameters? (Screenshot required)
This indicator can be programmed in a similar way to the RSI which is:
for the overbought line it can be configured between the values of 70 and 80% and for the oversold line between the values of 20 and 30%.
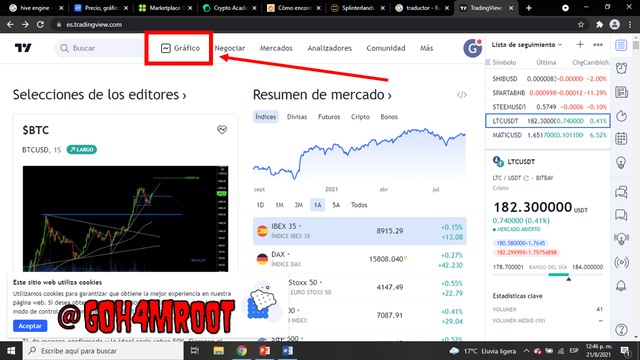
then we must follow the following steps to add the indicator to the operations view.
- step 1
log in to tradingview
- Step 2
go to graphics
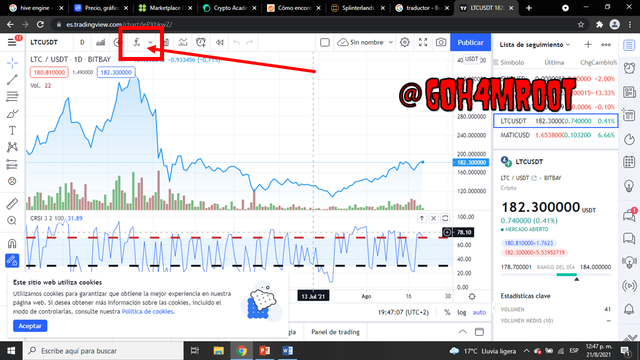
- step 3
click on indicators and strategies.
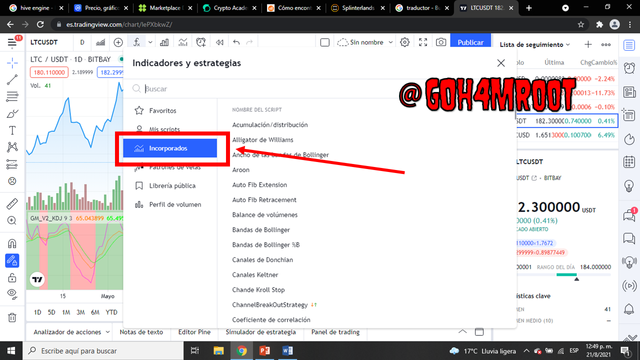
- Step 4
search defaults
- step 5
in the search box type KDJ
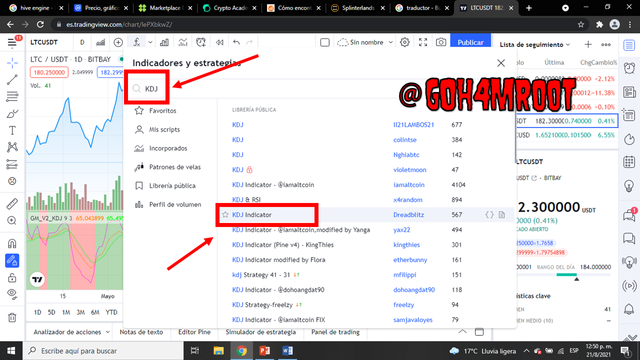
- step 6
select the indicate KDJ and voila, we have already added our indicator.
4- Differences between KDJ, ADX and ATR
The ADX indicator tells us what strength a trend has, this indicator does not determine a trend, that is, it does not show if the market is going to enter a downward or upward trend, it only shows us the strength of the market at that time, in In summary, if there are many sell orders, the indicator shows a downward force, but the values will be the same as if the trend was bullish.
the ATR indicator indicates market movements, a possible impulse in a trend and a consolidation of prices.
The KDJ allows us to follow trends, deduct market entries and exits, and oversold and overbought.
| ADX | ATR | KDJ |
|---|---|---|
| strength in a trend | market movements | oversold and oversold |
| does not differentiate trends | indicates sale and purchase | indicates sale and purchase |
| trend force in a market | define trends | define trends |
| define ranges | define ranges | define ranges |
| is not 100% reliable | is not 100% reliable | is not 100% reliable |
| the values are the same for any trend | values are set between lines 30 for bear markets and 70 for bull markets | values are set between the lines of 20 for oversold markets and 80 for oversold markets |
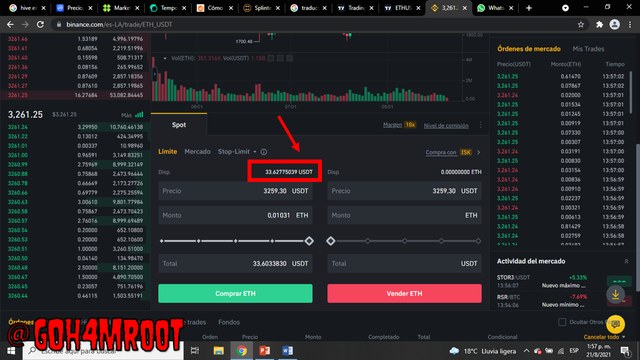
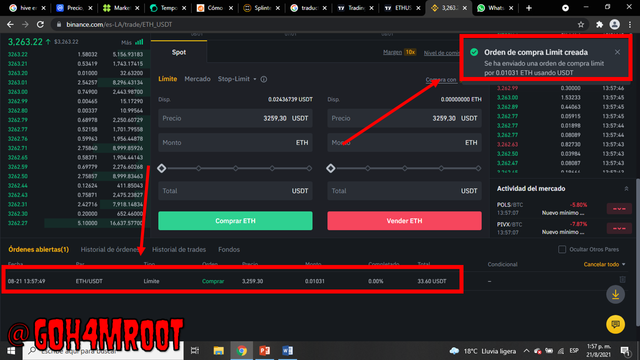
- I will use the ETH / USDT pair to buy $ 33 worth of ETH because the KDJ indicator converged indicating a reversal of the uptrend.
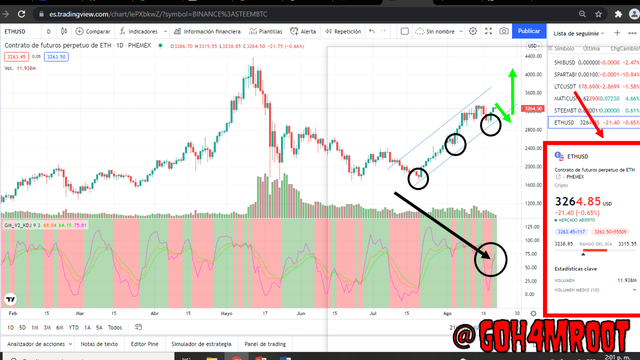
buy ETH
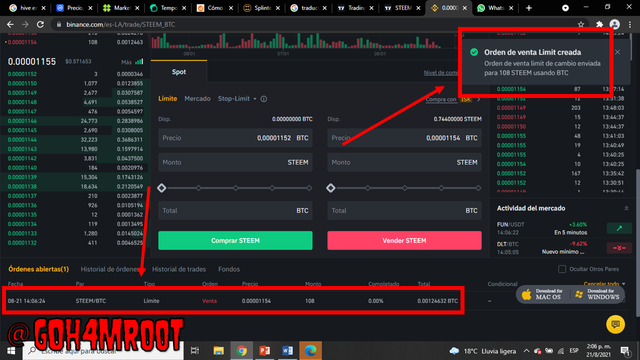
- To sell I have used the STEEM / BTC pair, although the market is lateralizing the KDJ lines indicate that they have converged indicating a downward trend change, so I will sell 100steem.
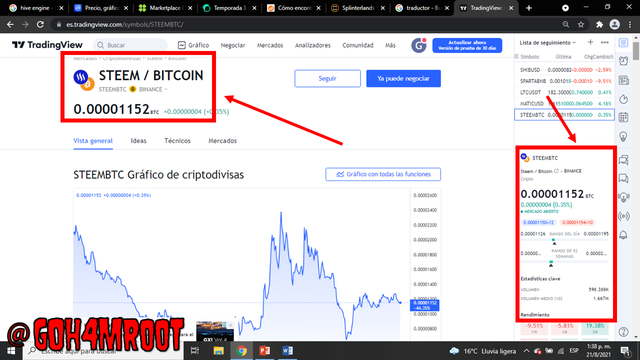
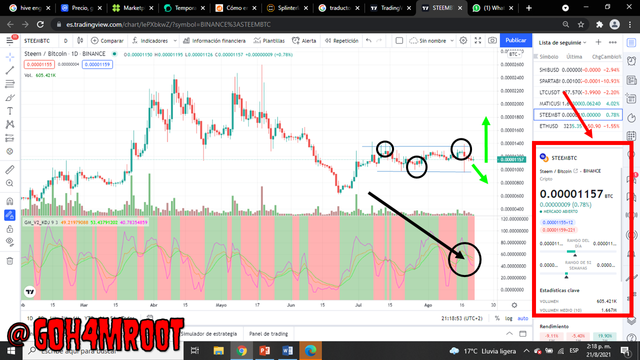
sell STEEM
Trading is a wonderful world, entering it requires a lot of courage, but with the help of these magnificent oscillators we avoid headaches.
In this class we learned how to use the KDJ indicator and how to calculate it using its equation.
We use this indicator to buy ETH and sell STEEM.
We show step by step how to add the indicator to the trading view.
Good job @g0h4mroot!
Thanks for performing the above task in the eighth week of Steemit Crypto Academy Season 3. The time and effort put into this work is appreciated. Hence, you have scored 6.5 out of 10. Here are the details:
Remarks
Overall, you have displayed a good understanding of the topic. You have performed the assigned task excellently. However, you did not provide the screenshots of the configuration parameters of KDJ indicator in task 3 and your work could benefit from more research.
That said, this is good work. Thanks again for your contributing your time and effort to the academy.