Steemit Crypto Academy | Season 3 : Trading The Dynamic Support & Resistance | Homework task for @cryptokraze


1- What do you understand about the Concept of Dynamic Support and Resistance? Give Chart Examples from Crypto Assets. (Clear Charts Needed)
There are a lot of trading techniques used for analyzing markets. One of these is support and resistance. Support is a level from which price rejects to start moving up. Resistance is a level or zone from where price rejects from to start moving downwards
There are different types of support and resistance
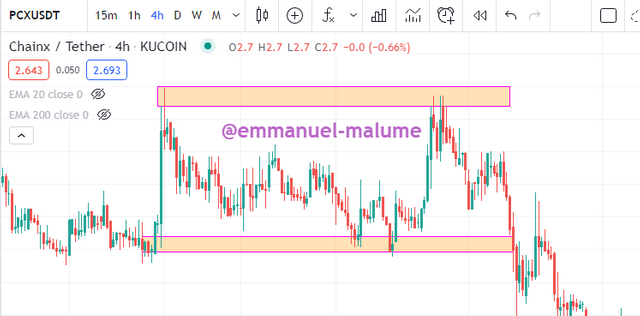
1.Horizontal support and resistance
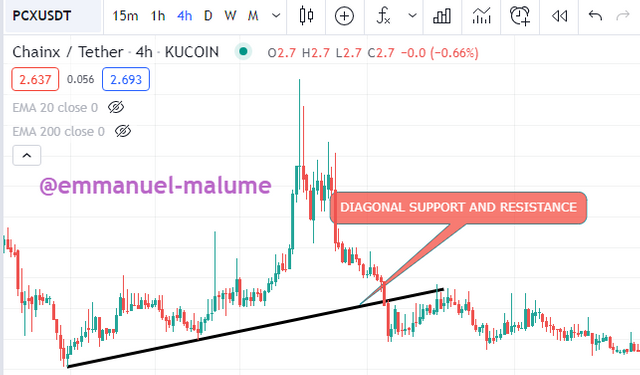
2.Diagonal support and resistance (trendlines)
3.Dynamic support and resistance
Today we will be talking about one of the types which are dynamic support and resistance. We all know anything dynamic refers to something that changes constantly. it is not a fixed something. So dynamic support and resistance refer to support and resistance that is closely and relative to price. The support and resistance are not fixed like horizontal support and resistance or draw with a straight line like diagonal support and resistance. This is gotten using indicators known as MOVING AVERAGES.
In using moving averages, there are different types of moving averages from simple to exponential to smothered. In this class, we would be using the exponential moving average as our dynamic support and resistance. The two exponential moving averages (EMA'S)is the 20ema and 200ema.
I would like to point out something very important which is the fact that when the price is above EMA'S we should be looking for only buy setups cause a price above EMA means we are bullish so the price would keep moving up
When the price is below EMA, we should be looking for sell setups cause a price below ema is a confirmed downtrend cause market is bullish then.
When price keep been slashed through by EMA it means we are in a range and in range, here EMA cant serve as either support or resistance
2- Make a combination of Two different EMAs other than 50 and 100 and show them on Crypto charts as Support and Resistance. (Clear Charts Needed)
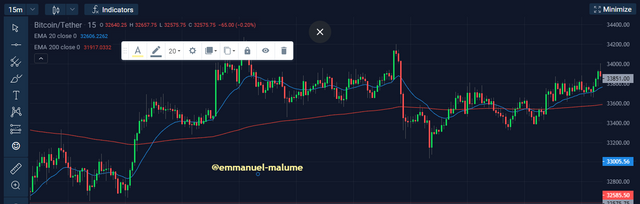
like I said earlier we would be using 20 ema and 200ema in this exercise. When we combine these two ema's we get dynamic support and resistance levels.
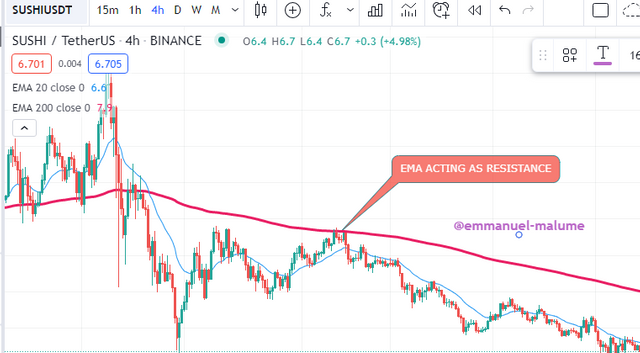
We can see how price respected the EMA'S and rejected from there to keep moving downwards. Ema's acting as resistance is often seen in downtrends.
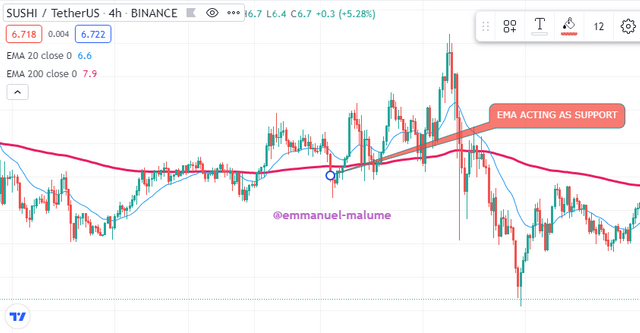
Price retraced to the Ema's and from there bounced to keep moving upwards with the ema serving as a support level. This is well seen in an uptrend market
3- Explain Trade Entry and Exit Criteria for both Buy and Sell Positions using dynamic support and resistance on any Crypto Asset using any time frame of your choice (Clear Charts Needed)
Before we start answering this question, as I said above, a price above EMA means buy setup is the ideal setup to look for while when the price is below we should look for sell setups. so let's look at buy entries and exits and sell entries and exits

1.We should always have our EMA put up in the chart and make sure the price is above ema
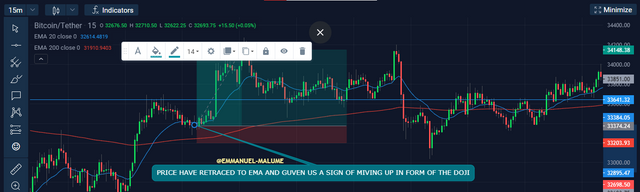
2.Price moves in waves so we should wait for the price to retrace after an impulse move and this retracement often retrace to dynamic support from where they move up. Remember our dynamic support here is the ema.
3.After price retraces, we wait for the price to show sign it is done retracing and wish to continue its movement before we fall, victims of invalidated support and resistance, cause support and resistance can always be broken
4.We wait for that signal which can come in form of a bullish engulfing candlestick or a bullish hammer and then we are good to enter the trade for a buy
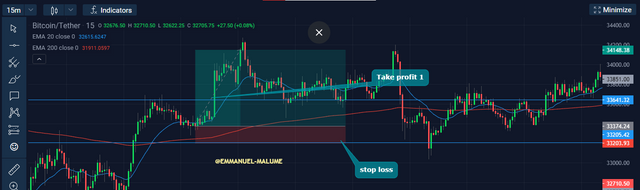
Most times, we have this dynamic support and resistance are invalidated leading to a change in market direction. So how do we protect our account against liquidation when the market goes against our analysis, we do this using a stop loss. Let's look at how to set up stop losses
1.After taking our buy trade, we should set our stop losses below wick of entry candle provided it's below ema but if it's not, set your stop loss some pips below ema.
2.If ever this stop-loss is hit, it means that the setup has been invalidated and we should watch out for a change in market structure or a range or market just faking out
We should also know when to take our profits and run cause the trading world can give and also take too even together with the profit it gave you and your capital. So we should know when to leave the market when in profit. we do this using a take profit. There can be more than one take profits in a trade from tp1, tp2,... to any amount you want. The most important here is the tp(take profit1). how do we set this up
1.After setting our stop loss, one's tp1 should be at a 1;1 R; R where we should be taking our first profit.
2.At this point, one should take out at least 50% of profit and investment and let the rest run while trailing stop losses
1.We should always have our EMA put up in the chart and make sure the price is below ema
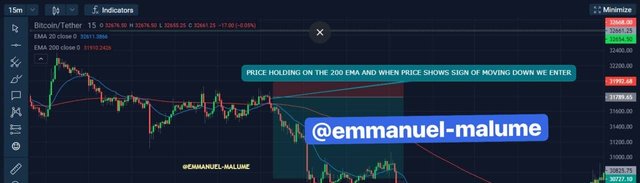
2.Price moves in waves so we should wait for the price to retrace after an impulse move and this retracement often retrace to dynamic resistance from where price moves down. Remember our dynamic resistance here is the ema.
3.After price retraces, we wait for the price to show sign it is done retracing and wish to continue its movement before we fall victims to invalidated support and resistance cause support and resistance can always be broken
4.We wait for that signal which can come in form of a bearish engulfing candlestick or a bearish hammer and then we are good to enter the trade for a sell
Like I said above this dynamic support and resistance can be invalidated leading to a change in market direction. So we protect our account against liquidation when the market goes against our analysis by using a stop loss and take profits. Let's look at how to set up stop losses first.
1.After taking our buy trade, we should set our stop losses above wick of entry candle provided it's below ema but if it's not, set your stop loss some pips below ema.
2.If ever this stop-loss is hit, it means that the setup has been invalidated and we should watch out for a change in market structure or a range or market just faking out
We should also know when to take our profits and run cause the trading world can give and also take too even together with the profit it gave you and your capital. So we should know when to leave the market when in profit. we do this using a take profit. There can be more than one take profits in a trade from tp1, tp2,... to any amount you want. The most important here is the tp(take profit1). how do we set this up
1.After setting our stop loss, one's tp1 should be at a 1;1 R; R where we should be taking our first profit.
2.At this point, one should take out at least 50% of profit and investment and let the rest run while trailing stop losses
4.Place 2 demo trades on crypto assets using Dynamic Support and Resistance strategy. You can use lower timeframe for these demo trades (Clear Charts and Actual Trades Needed)
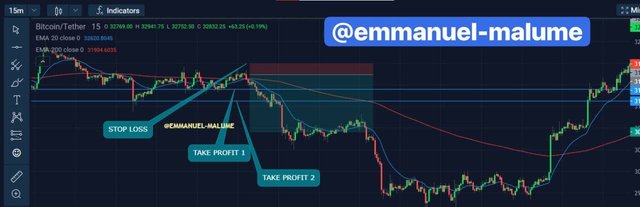
I took a sell trade on xrpusdt on stromgain platform . Here price retraced to the ema level below ema and we enter a sell trade on the 15min timeframe with my stop loss above ema and target is below with two tps which os the two blue lines
price moved too fast so ni couldn't screensghit the chart but i took the entry
price closed in profit for me with me making a 43$ profit
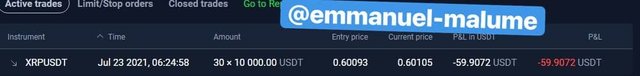
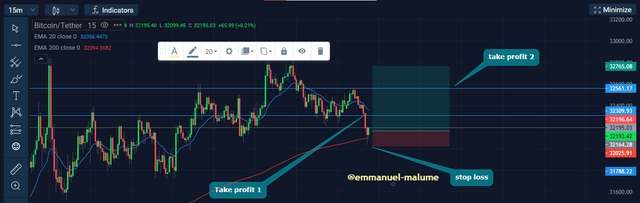
We are going to be taking a buy trade on our demo account using dynamic support and resistance.
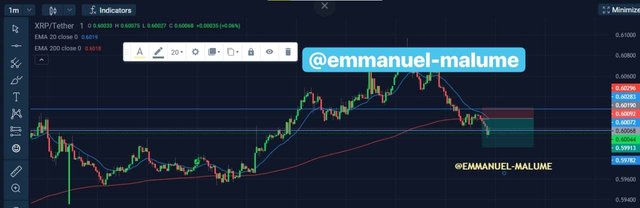
1.price is n a clear uptrend and have retraced to the two emas so we wait for a bullish signal and we saw a bullish engulfing candle which was a good signal so we entered using some pips below the candle as stop loss and our first tp in a 1:1 risk to reward ratio and the next tp to the next previous high while trailing others
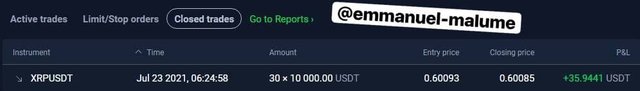
2.After a period of time we return to the chart and we can see price respected the emas as a support and moved above our take profits and kept going up
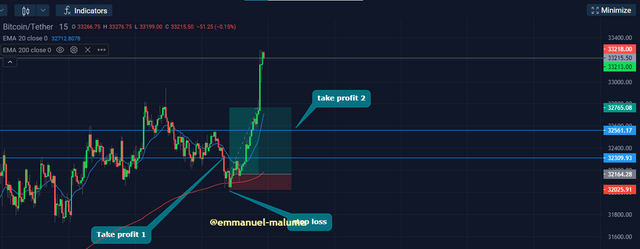
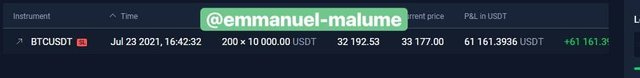
3.Resulting balance as we can see is seen below

Trading dynamic support and resistance is a very good way to follow price while getting good reversal points for price when moving. We can also perform proper trade management from stop loss to take profits. It was a really great lecture.
Thanks @
cryptokraze