Crypto Trading Strategy With Triple Exponential Moving Average (TEMA) - Steemit Crypto Academy - S6W2 - Homework Post for @fredquantum
.png)
Hello everyone, how are you all doing? I welcome you all to the Crypto Academy S6W2 course which is about Crypto Trading Strategy with Triple Exponential Moving Average (TEMA) Indicator, the course was thought by the professor @fredquantum.
What is your understanding of Triple Exponential Moving Average (TEMA)?
How is TEMA calculated? Add TEMA to the crypto chart and explain its settings. (Screenshots required).
Compare TEMA with other Moving Averages. You can use one or two Moving Averages for in-depth comparison with TEMA.
Explain the Trend Identification/Confirmation in both bearish and bullish trends with TEMA (Use separate charts). Explain Support & Resistance with TEMA (On separate charts). (Screenshots required).
Explain the combination of two TEMAs at different periods and several signals that can be extracted from them. Note: Use another period combination other than the one used in the lecture, explain your choice of the period. (Screenshots required).
What are the Trade Entry and Exit criteria using TEMA? Explain with Charts. (Screenshots required).
Use an indicator of choice in addition to crossovers between two TEMAs to place at least one demo trade and a real margin trade on an exchange (as little as $1 would do). Ideally, buy and sell positions (Apply proper trade management). Use only a 5 - 15 mins time frame. (Screenshots required).
What are the advantages and disadvantages of TEMA?

1. What is your understanding of Triple Exponential Moving Average (TEMA)?
Triple Exponential Moving Average (TEMA) is an indicator that is outlined to make the market price fluctuate smoothly, in a way that traders were able to understand and identify the market trend easily, the (TEMA) indicator allow the traders to ignore some errors they might be facing when operating with only moving average(MA), it also gives them the opportunity to explore and predict the market trend direction with multiple exponential moving averages (EMA) while taking out the errors that might occur on while the trading easily using the TEMA.
The TEMA is made up of one oscillating line which is premeditated from integrating about 3 EMA together using the same time interval, this type of indicator is broadly used by the crypto ecosystem. The TEMA was developed around January 1994 by Patrick G. Mulloy while trying to solve the issue of lagging while trading using other MA indicators, while assigning more weight to recent values.
With TEMA indicators, traders find it easier to track the market price movement more firmly than before, and also they were able to make more accurate calculations from the recent data that was collected.
With the help of TEMA, traders were able to identify when the market price fluctuates from an uptrend to a downtrend, when the price is going towards the uptrend, the TEMA indicator will be seen above the price while when the market price moves toward the downtrend, the TEMA indicator will be seen below the price which indicates that the market price is in favor of the sellers.
Q2. How is TEMA calculated? Add TEMA to the crypto chart and explain its settings. (Screenshots required).
We have some mathematical calculations that are given on the TEMA indicator, the following are the formula used in calculating TEMA
"TEMA = (3 × EMA1) - (3 × EMA2) + EMA3
Where;
EMA1 = Exponential moving average
EMA2 = EMA of EMA1
EMA3 = EMA of EMA2"
From the above formula, we can see that the TEMA is made up of three different EMAs which helps traders to have correspondent data when the EMA data is accumulated. The TEMA tries to redo the same number of 3 in EMA 1 and EMA 2, which also makes it easier for traders using the TEMA indicator to have a smooth sail while using it.
Adding TEMA to Price Chart
For this task, I will be using the trading view site to show how to add the TEMA indicator to our price chart.
First, you log in tolink, after that you click on the icon where you add indicators and type triple EMA on the search icon which will bring out the EMAs to your view as shown below.
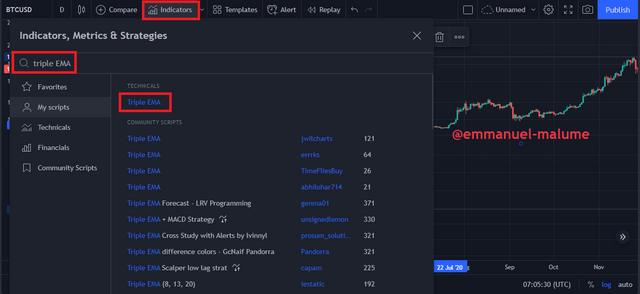
After searching for it, it will bring out multiple types of EMAs, the one we are looking for is the triple EMA which will be displayed first after searching for it, then you clicked on it which will show that you have to add the triple EMA.
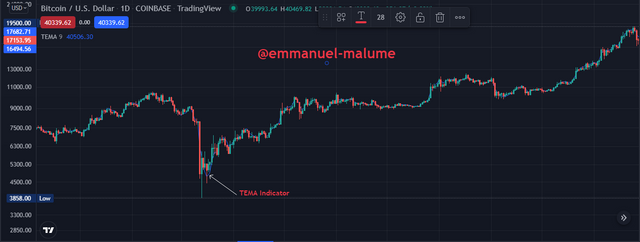
After selecting your TEMA indicator, you can change some settings of the indicator at the top left-hand side of the chart.
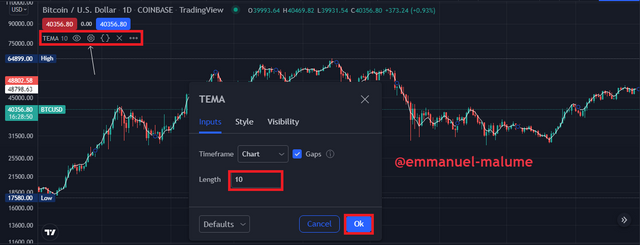
From the settings, I decided to change the length of the indicator from 9 to 10 so that the TEMA indicator will align perfectly well with the price pattern, you can change the length of the TEMA indicator to your liken, from the range 0f 9 to 30 if you like, so for me to have a clear indication on the chart, I decided to make use of length 10.
Q3. Compare TEMA with other Moving Averages. You can use one or two Moving Averages for in-depth comparison with TEMA.
As I have said earlier, the main reason why we have the TEMA indicator is so that we can reduce the lagging that normally happens when using the EMAs indicators, with the TEMA indicator, the traders were able to track the market price movement more efficiently with the fear of the indicator lagging behind the price trend, traders were able to know when they will be a market price reversal early with the help of the indicator.
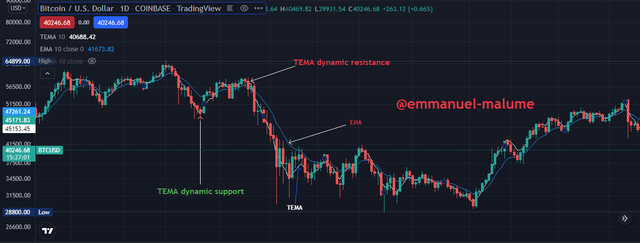
From the chart above, we can see two different indicators where the TEMA is displayed with the white color while the EMA is displayed with the blue color. From the two indicators, we can see that the EMA is a little bit lagging behind the TEMA indicator even though both indicators are displayed with the same length which is 10 even though the distance between them is not that much, from the chart, we can see that we were able to easily locate our resistance and support level easily.
And because of the fast and accuracy of the TEMA indicator, it allows it to aid the market price as dynamic resistance to price when it is at the bullish signal side, while it serves as dynamic support when the market price is at the bearish signal side. Compare to TEMA, the EMA indicator behind the market price shows that when the market price is rising towards the bull side, the EMA indicator will be spotted below the price while when the market price is falling towards the bear side, the EMA indicator will be seen at the top of the price, which sometimes can confuse the traders not knowing what to choose.
Comparing The SMA, EMA, And The TEMA
As I have stated earlier, we have different types of indicators, for this task, I will be making use of the SMA, EMA to complement the TEMA indicator.
The simple moving average (SMA) is an indicator that is mostly used by technical traders which helps them in determining the accurate price of an asset in the market, either the market price of that asset will continue going along the bull trend or the price will meet a reversal in the market and fall towards the bear trend.
The SMA indicator also lags behind the market price and also when operating different indicators together like the EMS, SMA, and TEMA, we can see that the EMA is lagging behind TEMA while the SMA is lagging behind the EMA and it is lagging far behind the TEMA indicator.
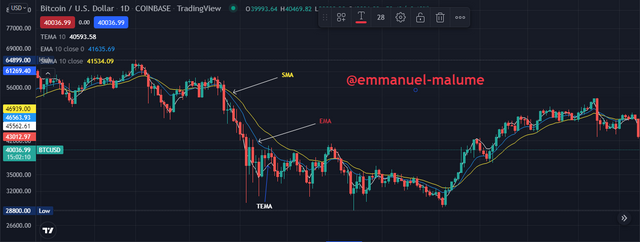
From the chart above we can see the SMA, EMA, and TEMA indicators that are been displayed, I set the length of the indicators to be the same which is 10, from the chart we can see the TEMA indicator has been aligned perfectly with the price pattern while the EMA indicator is lagging a little bit behind the TEMA indicator, while the SMA indicator is lagging far behind the two indicators, which shows that the EMA indicator is closer to the price pattern than the SMA indicator. The SMA indicator is shown with the yellow color while the EMA indicator can be seen with blue color, the TEMA indicator is displayed as white color.
As I have said earlier that the TEMA indicator aid the market price as a dynamic resistance when the market price is having an uptrend movement, while in the case of the EMA, SMA indicators are displayed as dynamic support when the market price is experiencing an uptrend, due to the sudden fluctuation from downtrend to an uptrend in the market price the EMA, SMA meets with a strong rejection from the market which causes the indicators to lag further behind the market price.
The TEMA indicator also aids the market price as dynamic support when the market price is experiencing a downtrend movement, while the EMA, SMA indicators are seen as a dynamic resistance when the price goes towards the downtrend when the market is experiencing a reversal in market trend which also caused the change in the market price direction.
Q4. Explain the Trend Identification/Confirmation in both bearish and bullish trends with TEMA (Use separate charts). Explain Support & Resistance with TEMA (On separate charts). (Screenshots required).
Like I said earlier the TEMA indicator helps traders in making more accurate predictions about the direction the market price is taking with the help of indicator line, with the help of the direction the indicator line, traders were able to decode the future direction the market price will be taking, also they were able to predict when they will be a sudden change in the price direction, which help them in taking a better position in the market.
TEMA Indicator Identifying a Bullish Trend
The bull trend can be recognized with the help of TEMA, when the TEMA indicator is seen moving towards the upward direction, it signifies that the market price direction at that moment is toward the bull trend, when the market price pattern is seen above the TEMA indicator, it is indicating that the current market is in favors of the buyers.
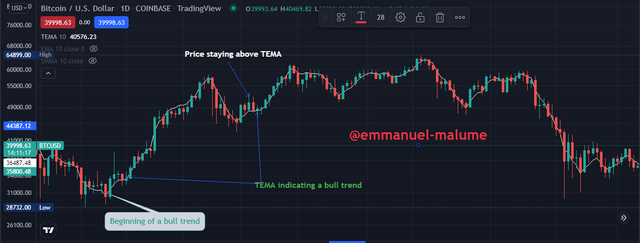
From the chart image above, we can see a position shown where the TEMA indicator indicates that the market price has met a reversal in price where the market fluctuates from the bear side and flicks towards the bull side, which shows the starting line towards the bull trend, while at a certain position we can see that the price pattern which indicates the bull trend is slightly above the TEMA indicator which confirmed our theory that the market price is at the bull trend.
TEMA Indicator Identifying a Bearish Trend
The logic we use in identifying the bull trend using the TEMA indicator can also be used for the bear trend, for the bear trend, the indicator line moves down the slope which indicates that the market price has fallen from the bull trend to the bear trend and also the indicator line is moving the in the same direction as the price.
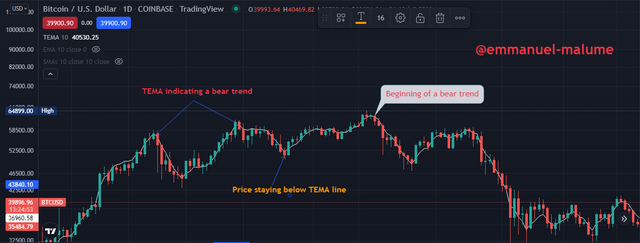
As shown on the chart above, we can see that the TEMA indicator line is moving in the same direction as the price pattern, also when the market price started falling towards the bear trend, the indicator line also fall alongside the price which means that the indicator and the price are moving in the same direction, after that we can see that the market price candle is slightly below the indicator line which confirmed that the market is in favors of the sellers.
TEMA and Resistance
As I have said earlier the TEMA indicator aid the market price as a dynamic resistance when the market price is moving towards the bull trend, showing a possible market pullback. Most times the TEMA indicator helps provide more information on the direction the price pattern is taken, when the TEMA indicator shows up along the resistance line after the market reversal, it allows the traders to have a little look back period where they will be able to track back the market price and knows that they will be a possible fall in the market price.
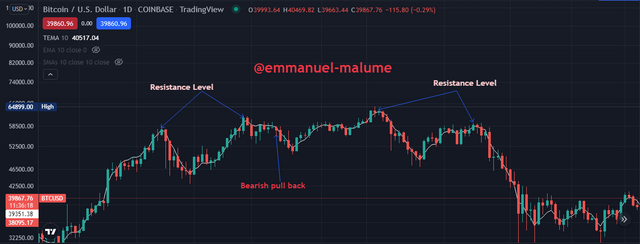
From the above chart, we can see that the TEMA indicator running along with the price pattern which also helps the traders to know the future direction the market price will be taking, after that we can see the indicator when the market price rise to the peak which also shows the resistance level of the market price and also shows a sign of market reversal after the resistance, we can see that the sudden fall in price which was followed by the TEMA indicator and after sometimes we can see that the market price that is falling suddenly shows the market price rejection after that the market experience a bearish pullback then the sudden price fluctuation to the bull side will be stoped.
TEMA and Support
When the market price is at the bottom, showing a sign of a breakout and the market price face a reversal signal, at that period the TEMA indicator will show a dynamic support line which will help the price to pull back from the resistance level to the support level, when the price approaches the support line it faces a strong rejection which helps the traders to know that they will be a sudden reversal in the market price, which means that the market price condition will change from a bear signal to a bull signal.
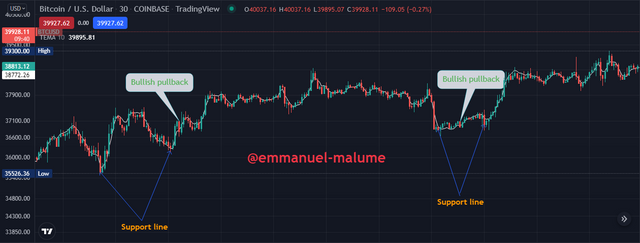
From the above chart, we can see that the TEMA indicator, indicates that the support level is drawn at the bottom when the market price faces a sudden rejection between the support and the resistance level which causes a sudden reversal in price, along the line when the market price was rising.
Q5. Explain the combination of two TEMAs at different periods and several signals that can be extracted from them. Note: Use another period combination other than the one used in the lecture, explain your choice of the period. (Screenshots required).
By using two TEMA indicators, we will be able to set different lengths for the two indicators where one indicator will have a different period to the other, with both indicators the traders will be able to ascertain the exact position they want to take in the market.
While using the two TEMA indicators, it is necessary for traders to choose a period that will be more profitable for them and a period that they will be able to easily understand the flow of the market easily. While using the two indicators, it is necessary for traders to know some certain things about the indicators like;
When setting the period for the TEMA indicator, it is important to know that the shorter length setting will be able to react faster to the movement of the market price than the longer length settings.
When executing a buy or sell trade, it is necessary for the trader to know that when the shorter TEMA comes before the longer one it is an opportunity to execute a sell order, while it is possible for the market price to show up below the two TEMA lines.
Setting my TEMAs length, the first TEMA indicator I will be seeing my length to be around the period of 10, and for the second TEMA indicator, I will be setting the length to be within the period of 25 so that my TEMAs will not be overlapping each other too much, also for me to be able to have an accurate prediction of the price movement.
Buy Signal
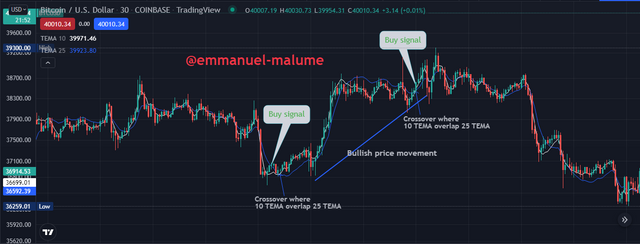
From the chart above, we can see the method used to utilize the crossover between the TEMAs indicators, with the help of the TEMAs indicators I was able to know the right angle to set my buy signal easily at exactly the period where the shorter TEMA indicator overlaps the longer one leading to the top of the trend.
Sell Signal
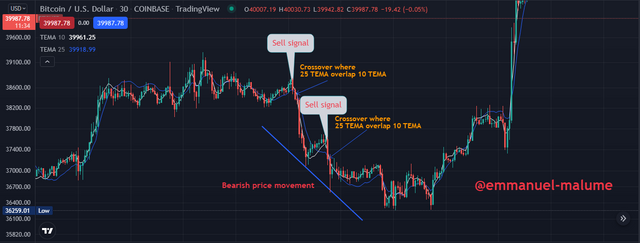
From the above chart, we can see the position where the TEMAs indicators cross each other, in this case, the longer length period is the one crossing over the shorter length period indicator, with that we were able to mark our entry point for the sell order easily.
Q6. What are the Trade Entry and Exit criteria using TEMA? Explain with Charts. (Screenshots required).
In every trading, they are several rules that you have to meet up before you start trading if not you will end up making a huge loss instead of making a profit from such trade because you didn't follow the rules, same goes for the TEAM indicator when using it to make your entry point for a trade, the criteria for the TEMA is as follows;
The first thing you do before making your entry for the trade while using the TEMA indicator is that you input two TEMA indicators so that you will have a more profound prediction in knowing the exact position to make your entry.
The next thing you look into is that when making an entry for a buy signal, you wait for a crossover between the TEMAs indicators where the shorter one crossover the longer one, and after the crossover then you can find a perfect entry point.
For a good entry point, you have to allow at least two trade candles to pass over before making an entry because with that you will be more sure that the market price won't experience any sudden breakout which will lead the price back to the bear side.
After making your entry, to be on the safer side you can enter your stop loss to be at a risk-reward ratio which is around 1:2 so that you can have a rewardable trade, where you won't be making much of a loss even when the market meets a sudden reversal.
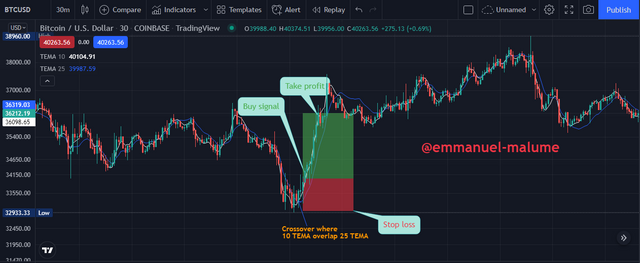
From the chart above, we can see the price movement where the price break through the resistance line and move towards the bear trend, along the line the bear trend reach a certain peak where the shorter length TEMA indicator crossover the longer length TEMA, at that period the higher TEMA was overtaken and the Shorter length TEMA shoot upward toward the bull trend which helps the trader to know that they are high chances for the price to stay at the bull trend for a while, within that period the trader will be able to make a perfect entry to buy, after the entry I take my profit when the price rises to the peak, my stop loss was placed below the previous lows.
Sell Trade Entry and Exit Criteria
Just like when we are making an entry for the buy order, the same thing should be done for the sell order where you are to input two TEMAs indicators before making your trade entry.
The next thing you look into is that when making an entry for a sell signal, you wait for a crossover between the TEMAs indicators where the longer one crossover the shorter one, and after the crossover then you can find a perfect entry point.
For a good entry point, you have to allow at least two trade candles to pass over before making an entry to sell because with that you will be more sure that the market price won't experience any sudden breakout which will lead to the price back to the bull side.
After making your entry, to be on the safer side you can enter your stop loss to be at a risk-reward ratio which is around 1:2 so that you can have a rewardable trade, where you won't be making much of a loss even when the market meets a sudden reversal.
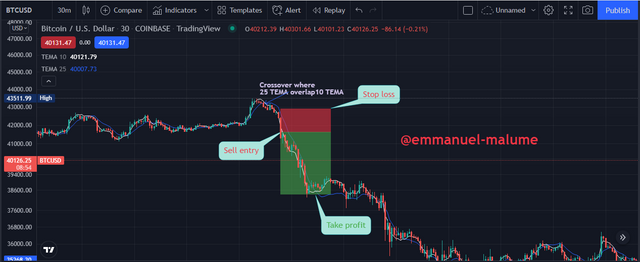
From the chart above, we can see the price movement where the price break through the support line and move towards the bull trend, along the line the bull trend reach a certain peak where the longer length TEMA indicator crossover the shorter length TEMA, at that period the shorter TEMA was overtaken and the longer length TEMA shoot downward toward the bear trend which helps the trader to know that they are high chances for the price to stay at the bear trend for a while, within that time the trader will be able to make an entry to sell, after the entry I take my profit within the nearest support line, my stop loss was placed above the former highs.
Q7. Use an indicator of choice in addition to crossovers between two TEMAs to place at least one demo trade and a real margin trade on an exchange (as little as $1 would do). Ideally, buy and sell positions (Apply proper trade management). Use only a 5 - 15 mins time frame. (Screenshots required).
- Using the RSI and TEMA Indicator: With the help of the TEMA indicator, traders were able to make a good entry
with the help of the RSI indicator which helps the trader in knowing how profound the market condition is.
With the RSI level set as 30 and 70, where we have the market price moving below the 30 RSI which can be reviewed as the market has been oversold while we might have the possibility of the market having a reversal in the bull signal. While having the market price be above the RSI indicates that the price in the market might meet the condition for overbought while having a possibility for the bear signal to be meet a sudden reversal.
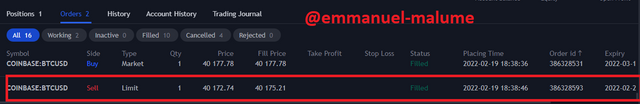
Demo Trade (SELL Trade) BTCUSD 15 MINS
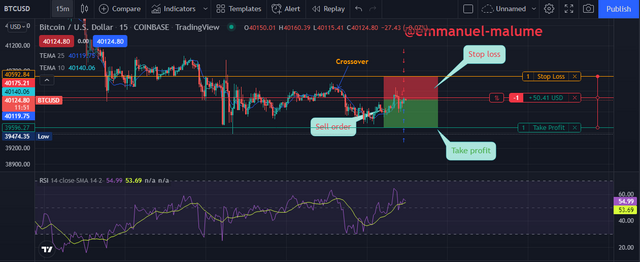
From the chart above, we can see that the longer length TEMA indicator which length is at 25 crossovers the shorter length TEMA with the length of 10, with that, I was able to choose a favorable position to make my sell order. Also, the RSI line corresponds with the price movement where the line break below 50, which helps me to determine the sell position early. I placed my entry point when the price is at $40175.42, then I took profit when the price is at $39596.27, then my stop loss at $40592.87.
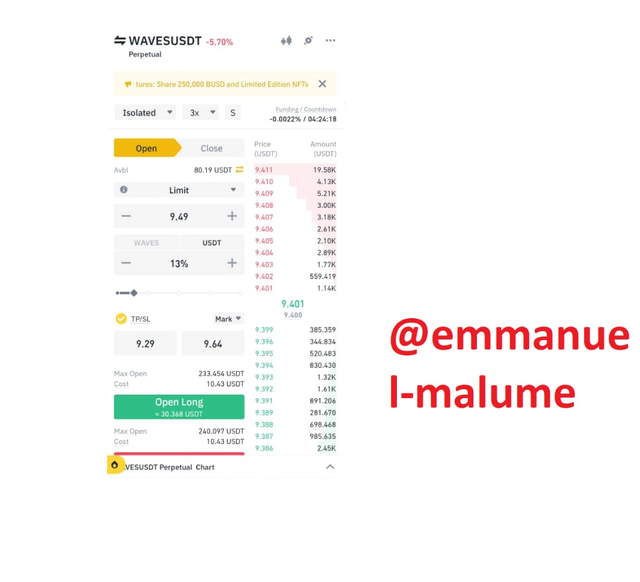
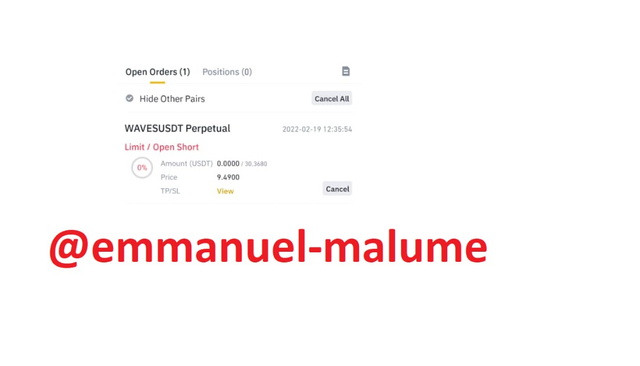
Real Trade of WAVESUSDT - Sell Order
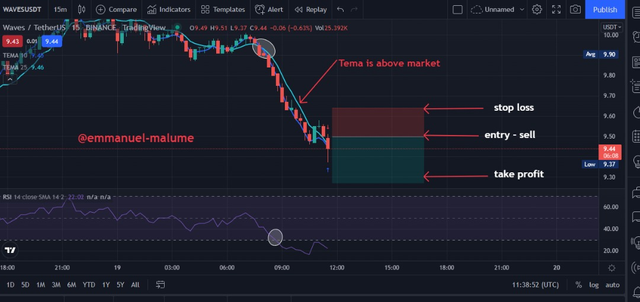
I made a sell entry through the Binance trading app, I made an entry to sell waves coin market while using two TEMAs indicators, after that, I made the trade using a 5m interval chart, my entry price was at $9.45 USDT then I set my stop loss at $9.64 USDT, then I set to take profit at $9.28 USDT.
After obtaining my market entry and exit information, I establish the binance mobile application to carry on my trade.
Q8. What are the advantages and disadvantages of TEMA?
Advantages of TEMA Indicator
the TEMA indicator correlated to a price change immediately than other moving averages (MAs), this is as an effect of the lag reduction based on its analysis of the market price. This guarantees an opportunity for traders to have a better entry point when trading.
With the help of the TEMA indicator, traders were able to the support and resistance level of the market price, it is indicated that when the market is on the support level then the TEMA indicator line will be seen shooting back up which indicates that the market price is rising towards the bull signal, same goes for the resistance line.
The TEMA indicator also displayed the change in the price direction, when the price shoot up the indicator will be seen shooting up alongside the price pattern, while when the price shoot down the indicator will be seen shooting down alongside the price.
Disadvantages of TEMA Indicator
While the TEMA indicator help reduces lag, it sometimes also inherit some issues like when the TEMA track the market price faster than other MAs, but when a small price move across than the initial assumption, which means that the TEMA won't be able to keep track of such price.
The TEMA indicator is most useful in trending market situations. When you don't have a trending market, then the TEMA indicator will frequently develop fake signals and market distortion.
The TEMA indicator sometimes is not trustworthy in an inconsistent market because sometimes when it reduces the lagging of the market, it sometimes comes with instability in the price which sometimes causes the system to have a distorted signal.
Conclusion
From our explanation so far, we can see how wonderful the TEMA indicator is to technical traders, we also learned how to calculate the TEMA indicator, we also learn how to use two TEMA indicators for a better analysis, also learn how to identify the support and resistance level of the market price using the TEMA indicator. With the help of the TEMA indicators, I was able to make a demo trading and at the same time, I did real-life trading using the TEMA indicator to analyze the market in order to have a better entry and exit point.
I want to say a big thank you to professor @fredquantum for his wonderful lecture on this course which helps in widening my understanding of the course which is Crypto Trading Strategy with Triple Exponential Moving Average (TEMA) Indicator.