Crypto Academy Season 03 - Week 04 | Advanced Course - Trading The Dynamic Support & Resistance by @eloksjoseph

1 - What do you understand about the Concept of Dynamic Support and Resistance? Give Chart Examples from Crypto Assets. (Clear Charts Needed)
2 - Make a combination of Two different EMAs other than 50 and 100 and show them on Crypto charts as Support and Resistance. (Clear Charts Needed)
3 - Explain Trade Entry and Exit Criteria for both Buy and Sell Positions using dynamic support and resistance on any Crypto Asset using any time frame of your choice (Clear Charts Needed)
4 - Place 2 demo trades on crypto assets using Dynamic Support and Resistance strategy. You can use lower timeframe for these demo trades (Clear Charts and Actual Trades Needed)

CONCEPT OF DYNAMIC RESISTANCE AND SUPPORT
Dynamic Resistance On Live Chart (50 EMA)
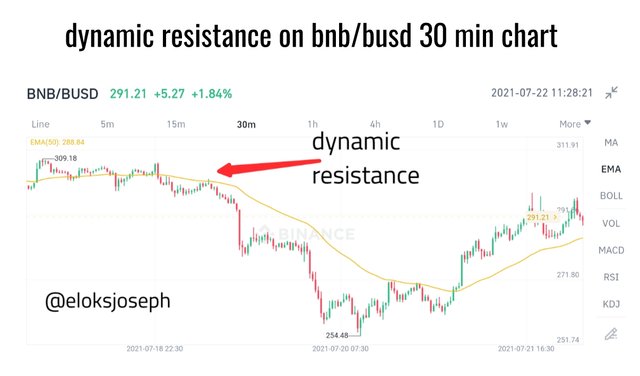
screenshot from binance mobile app
Dynamic Support On Live Chart (50 EMA)
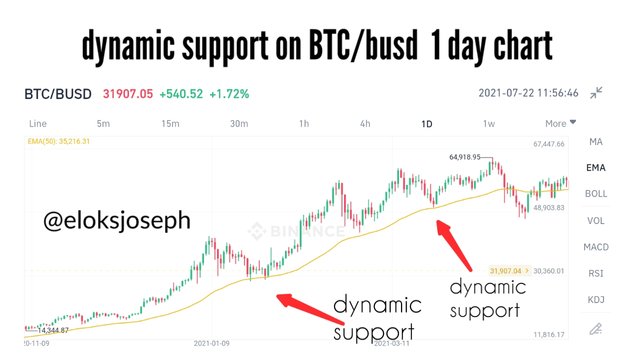
screenshot from binance mobile app
COMBINATION OF 60 AND 120 EMA
- EMA 60-yellow
- EMA 120-green
Dynamic Resistance On Live Chart (60 And 120 EMA Combination)
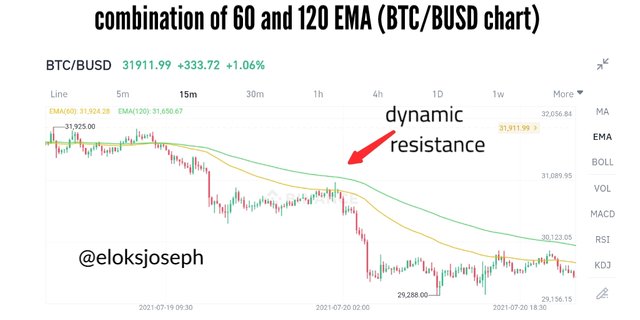
screenshot from binance mobile app
Dynamic Support On Live Chart (60 And 120 EMA Combination)
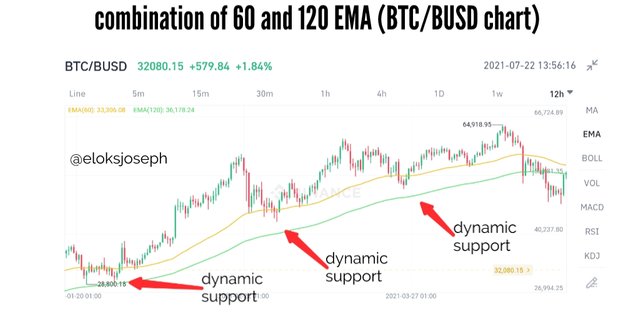
screenshot from binance mobile app
* * *
TRADE ENTRY AND EXIT CRITERIA
I'll be making use of the combination of 60 and 120 EMA
BUY TRADE ENTRY AND EXIT CRITERIA USING THE DYNAMIC SUPPORT
To enter a buy trade, we'll be making use of the dynamic support. To set up a successful buy order using dynamic support, the following must be done;
We must first add the EMAs to the chart. This can be done on most crypto trading exchanges . (I'll be configuring mine to 60 and 120)
To trade using dynamic support, the price chart should be above both the 60 and 120 EMA.
The trader should then monitor the chart until it crosses or touches the 60 EMA without cutting past the 120 EMA too. That is, the chart should be contained between the 60 and 120 EMA.
After it has touched or crossed the line , the trader should wait for it to come back up from the 60 EMA . This validates the setup.
The trader can now place a buy order after the chart has moved above the 60 EMA.
Let's see a chart example;
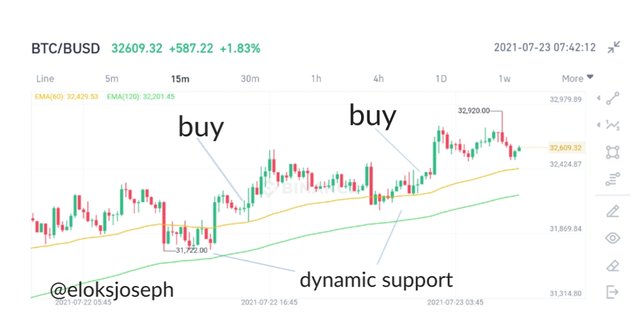
15 MINUTES BTC/BUSD CHART
screenshot from binance mobile app
From the chart above ,you can see the chart touching and going below the 60 EMA but not cutting through the 120 EMA. When the price has reversed and is above the 60 EMA, we can now pick entry points which I have identified.
Moving on, let's now examine the exit points when using the dynamic support in a buy order.
We should know that in every trade a stop loss is important. So we'll be setting our stop loss. The stop loss should be set below the 120 EMA level.
If the stop loss is reached, it is advisable to leave the trade and await another entry opportunity.
The take profit should be set in the ratio 1:1 with the stop loss. That means the price we risk is the price we'll get as reward.
Exiting the trade is also advisable once the price has hit the take profit.
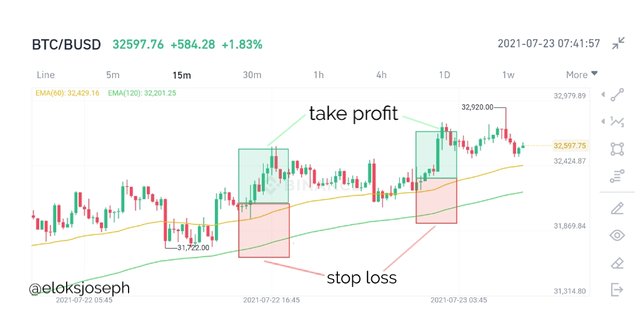
15 MINUTES BTC/BUSD CHART
Screenshot from binance mobile app
Using the 1:1 risk reward ideology, I have marked out the possible take profit and stop loss in the chart above. As you can see there are 2 possible buy trades that could have been made so catching the trend early helps and increases chances of making profit.
Also, from the marked out points in the graph , it could be seen that the take profit points were met and therefore,a successful buy trade would have taken place. Putting that in mind, let's now see the criteria for sell orders.
SELL TRADE ENTRY AND EXIT CRITERIA USING THE DYNAMIC RESISTANCE.
Sell order often uses dynamic resistance. To get a successful sell order, it is important to follow the steps ;
First of all add the 60 and 120 EMA to the chart.
The chart must be below both EMA to be able to start a sell entry.
The trader should note when the price breaks or touches the 60 EMA. If it doesn't cross the 120 EMA and then reverses , it is a valid sell entry point. That is ,after it had broken the 60 EMA, it then comes out again without breaking the 120 EMA.
The trader should pick the entry point as the price comes out of the 60 EMA.
We can refer to a real graph example below;
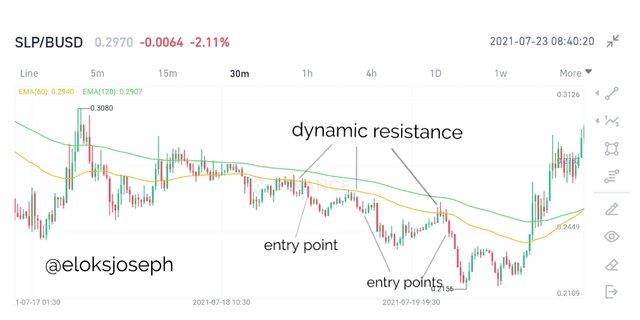
SLP/BUSD 30 MINUTES CHART
Screenshot from binance mobile app
From the graph above, you can see the multiple dynamic resistance that I marked out ,meaning of the trader had caught this trend early enough, a lot of profit would have been made from buy position. In the 3 instances I marked out , the price could be seen to break through the 60 EMA but never breaking out of the 120 EMA instead, it reversed and came out of the 60 EMA , making it a valid sell entry.
Now that we have seen the entry criteria, let's take a look at our exit criteria.
First, we have to set our stop loss
The stop loss should be set above the 120 EMA
Our take profit should also be set in the ratio 1:1 with our stop loss.
When the price hits either the stop loss or the take profit ,it is time to exit the trade.
An example is shown in the chart below;
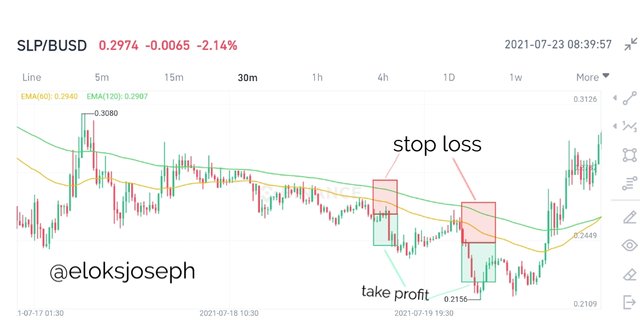
SLP/BUSD 30 MINUTES CHART
Screenshot from binance mobile app
From the image above , I marked out possible trades, showing the exit points ( take profit and stop loss). The take profit and stop loss was set in a 1:1 ratio which is a very good ratio for people who are new to to method of trading.
From the graph ,you can see the take profit in the sell position was met which means if it was a live trade, profit would have been made.
* * *
Now that we've seen the theoritical aspects,let's now use this on a live trade.
DEMO TRADE USING DYNAMIC RESISTANCE
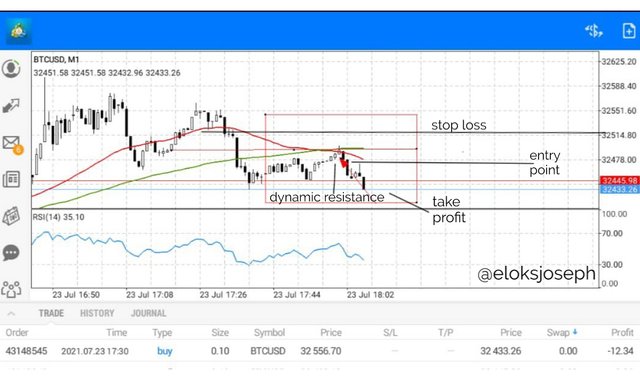
For this section, I'll be using the BTC/ USD pair (1 min) on metatrader 4 using 60 and 120 EMA. In the live chart, I noticed the price was below both EMA so I waited for it to move up a little and wachd it cross the 60 EMA. When it got out again, I entered into the trade in a sell position.
- ENTRY POINT: $32468.13
- STOP LOSS: $32520.00
- TAKE PROFIT: $32428.05
Screenshot from metatrader 4
Screenshot from metatrader 4
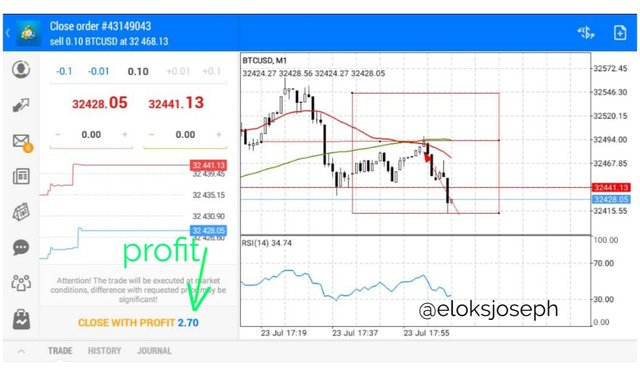
At the end of the trade ,I closed with a 2.7 dollar profit after utilizing the dynamic resistance in live trading.
DEMO TRADE USING DYNAMIC SUPPORT
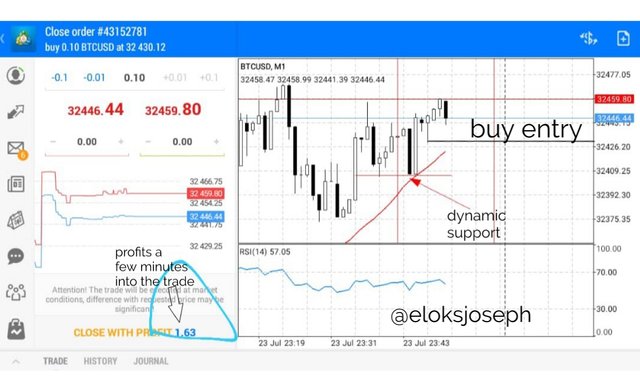
Also using the BTC/USD pair (1min) on meta trader 4 using the 60 and 120 EMA. Noticing that the price was above both EMA, I waited for it to cross the 60 EMA abd watched it rebound. A few candles after it was back from the 60 EMA, I placed a buy entry.
In the image below, I have marked out the entry point.
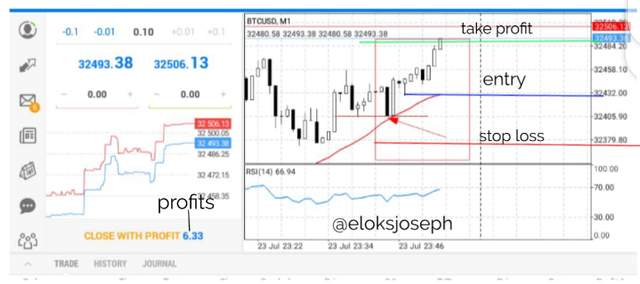
- ENTRY POINT:$32430.12
- STOP LOSS:$32368.00
- TAKE PROFIT:$32493.00
Screenshot from metatrader 4
screenshot from metatrader 4
I eventually closed the buy entry trade with a $6.33 profit.
CONCLUSION
From what we have learnt so far, it has been shown that resistance and support levels areht restricted to being horizontal alone but can also be diagonal. They can now be referred to as dynamic support and resistance.
These dynamic support and resistance can be identified using the Exponential Moving Average ( EMA) . The combination of 2 averages often give more accurate and secure levels of dynamic support and resistance.
The dynamic support and resistance is also applicable in live charts and can be utilized by traders. If the trend is caught early, several entry points could be utilized.
CC: @cryptokraze
Dear @eloksjoseph
Thank you for participating in Steemit Crypto Academy Season 03 and making efforts to complete the homework task. You got 9/10 Grade Points according to the following Scale;
Key Notes:
We appreciate your efforts in Crypto academy and look forward for your next homework tasks.
Regards
@cryptokraze