In-depth Study of Market Maker Concept]-Steemit Crypto Academy | S4W6 | Homework Post for @reddileep
Define the concept of Market Making in your own words.
What / Who is a Market maker?
A market maker is a person or an organization who buys and sells assets in one account. They actively quote two sided markets( the difference between the lowest price a seller is willing to sell and the highest price that a buyer is willing to buy). A market marker does this so as to provide liquidity for the market while the earn profit from the differences in the bid ask price.
They help to ensure there is enough liquidity and enough volume for trading in the market so that traders can trade easily, without these guys it will be a bit difficult to trade as there will be low liquidity in the market.

Explain the psychology behind Market Maker. (Screenshot Required)
PSYCHOLOGY BEHIND MARKET MARKER
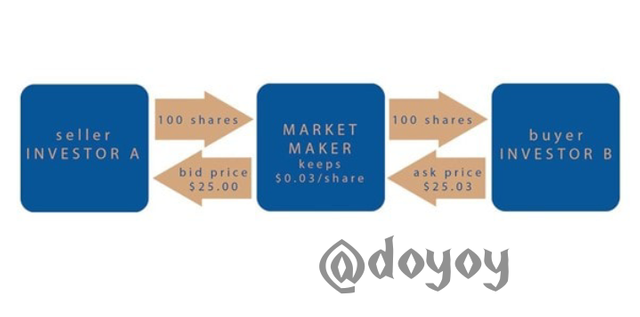
Another thing is that they are the ones that always buy every asset we want to sell at any time and also sell every asset we want to buy to us at any time but at a price which has been quoted by them.
So they sell the asset to us at a higher price than the actual price and also buy from the seller at a lower price of the asset.
Let's look at this practically, if for example a particular firm is acting like a market makers for crypto X, firstly they add liquidity to the asset by adding liquidity pool of Crypto X- USDT. Let's say he added a liquidity of $10,000.
So he also quote two sided market i.e depending on the demand and supply of the asset, if the price of an asset is $1 they set a sell price at maybe $1.1 and set a buy price at $0.9 so a trader buys from them at a lower price and sell to them at a higher price. This cycle continues as they are like the wholesaler of the crypto asset.
Explain the benefits of Market Maker Concept?
BENEFITS OF A MARKET MARKER
- The market markers are responsible for keeping a new project alive with value by providing bid and ask price and also providing liquidity in the market.
- The market makers helps to bring more investors into a project when enough liquidity is added and the value of the asset starts increasing
- The market makers can set the price at whatever price they seem fit, especially setting it at a higher price than the price of the asset for example, an asset with price $10 can be set at $12 by the market makers.
- They facilitate a seamless trànsaction by making its easier for investors and traders to buy and sell asset with ease.
- Without market making there will be low trànsactions of the asset with fewer investors.
Explain the disadvantages of Market Maker Concept?
DISADVANTAGES OF MARKET MAKER
Market makers can trade against teasers and investors by presenting clear conflict of interest in order execution
They can set bid and ask price that are not too pleasant for traders
They can manipulate an asset price so that traders doesn't meet their target
Most times higher amount of slippage can occur
Market makers don't usually support scalpers and this hinders them from getting their orders filled at their specified price.
Explain any two indicators that are used in the Market Maker Concept and explore them through charts. (Screenshot Required)
INDICATORS USED IN MARKET MAKER CONCEPT
There are various indicators that can be used in the market makers concept which varies from MACD, TDI, EMA and several other indicator. This indicators makes us realize that the traders analyse the market horizontally, by looking at past data of an asset while the Market makers are not really concerned about the past data or the indicators at all, they analyse the market vertically using the order book which shows them where take profits, stop kisses and pending orders are set at.
These days are what they use in influencing the price movement. But since as a trader we don't have the total view of the order book we can only use the indicators to analyse the market, The market makers makes use of clusters on the order book, they can reverse the price of the asset but they can push the price to a level that is beneficial to them, that is they move it to the cluster of stop losses set. In a nutshell they act against the market crowd but also they need some people to move the asset of the price to that direction.
Let's look at the indicators that can give us a clue of where the market is going and how to move with the market makers.
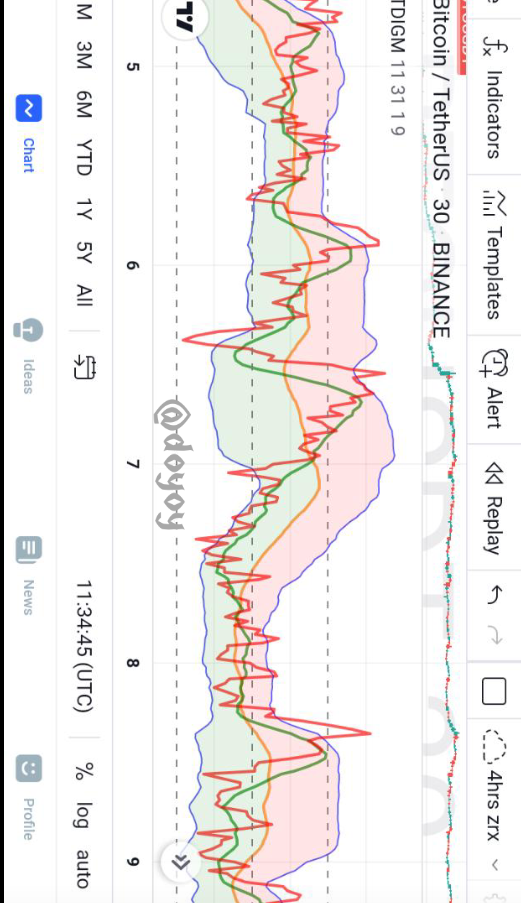
TRADERS DYNAMIC INDEX (TDI)
Trader dynamic index is an indicator that is used to define current market trend and find a very good entry point for traders. It was created by Dean Malone and was created majorly for the forex market before been introduced to the crypto market.
It is based on three popular indicator which are the Relative strength index, moving average and the Bollinger bands which makes it seem like a bit complex indicator. The relative strength index work is to discover whether the current trend is weak, strong or over heated and it also helps indicate reversals.
The RSI is always smoothed by the Moving average to make it more readable, while the Bollinger bands helps to show the oscillation amplitude of the price and the trend direction.
The TDI comprises of five lines, two which are the RSI lines and three which is the Bollinger bands. The red line is called the fast line, while the green one is the signal line, it is calculated using a longer average period. The RSI as said above shows the trend strength and volatility and their crossing gives short term signals.
The two purple line of the Bollinger band are the one who constitute the trading channel while the orange line is the main line.
The middle of the indicator is level 50 and the levels 30 and 70 are also marked, any line above the level 70 area is an overbought and every line below the 30 area is an oversold.
The levels 70.and 30 indicates a price reversal also whenever the orange line crosses the 30 level downward it indicates a low has been formed in the market also when the yellow line crosses the 70 area it indicates a higher high in the market.
HOW TO ADD ON THE CHART
To add the TDI on the chart using the trading view app, we first launch the app then navigate to the chart interface, then we navigate to the indicator button section and click on it, we then search for the TDI on the search bar and choose one of the indicators.
As seen in the screenshot above the indicator will appear on the chart
HOW TO MAKE USE OF THE INDICATOR
Firstly, we need to look for where the red line is going above the orange line the orange line is very important in this indicator. When the red line is above both the green and yellow line it means there is begining to be a buying pressure in the market, but before going for a buy we need other signals from the indicators so we wait for the green line to also cross above the yellow line having in mind that the red line must not go above the upper purple line at this point because when the red line goes above the purple line it simply means that it is in the overbought region and there will be a reversal soon.
Next we place a buy at the closing of the candle after the green line must have broken pass the orange line, when the green line passes the line it shows that buyers are buying and this is a appositive sentiment.
The next thing is where to place the stop loss and this is to place the stop loss below the point where the red line and green line crossed below the yellow line which indicates a DOWNTREND and set as your stop loss.
You then take profit after the green and red line crosses the 70 level area, this is when the reversal will take place as it shows that there is exhaustion in the buying pressure and it's the best time to take profits.
The reverse is the case for a sell position the steps outlined above just need to be inverted. This is a good indicator for a scalper and it can help to beat the market makers at their games.