Explain the volume indicator in your own words.
Use a platform other than Tradingview to present the volume indicator on a chart and show how to configure its parameters by justifying your choices. (Screenshot required)
What is the link between Volume and Trend and How to use volume to predict a trend reversal? (Screenshot required)
How to use the volume to have a signal confirmation? (Screenshot required)
How does the volume reflect the evolution of prices in the charts and why does the volume sometimes anticipate the price? (Screenshot required)
Is it better to use the volume indicator alone or use it in parallel with another indicator when trading? Justify your answer
The volume indicators are multiple, choose one of them to briefly explain its usefulness in crypto trading.
Conclusion:
Hello, my fellow crypto colleagues, welcome to the second week of the season 4 crypto academy. I'm glad to present my homework again today. Thanks for all your support. I'm grateful.

Question 1
Explain the volume indicator in your own words.
Volume indicator is used to determine the number of contracts/asset/shares traded in a particular given time or period. Volume of assets is determined by the users or traders. When they transact within themselves, by buying and selling, there would a trading volume with respect to their transactions
For instance, if I sell a crypto asset to Mr A, lets say 10 BTC for $5, the volume of our transaction would be $50, or 10 BTC depending on how the platform where we traded terms the transaction. So every transaction made within a certain period (1hr, 5hr), and so on would reflect in the volume chart
We should understand that volume deals with numbers, and numbers is also ascribed to values, so volume shows the value of traded assets based on the time frame they are traded. One thing that amused me about the volume indicator was that I've been seeing it for a long time, and to say the fact, I've never paid attention to it until the prof
@Kouba01 gave a lecture on it. So this fact shows how important and helpful the volume indicator could be whereas many people (including me never see it as anything until now)
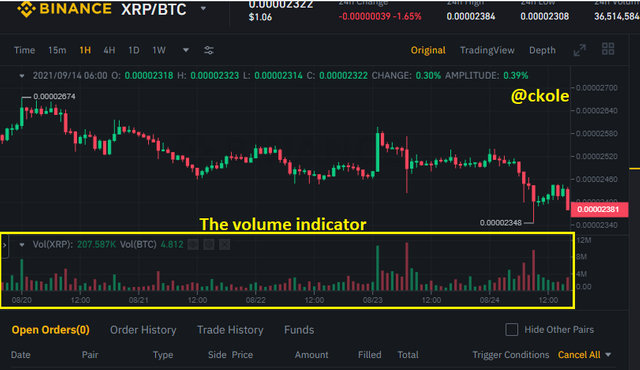
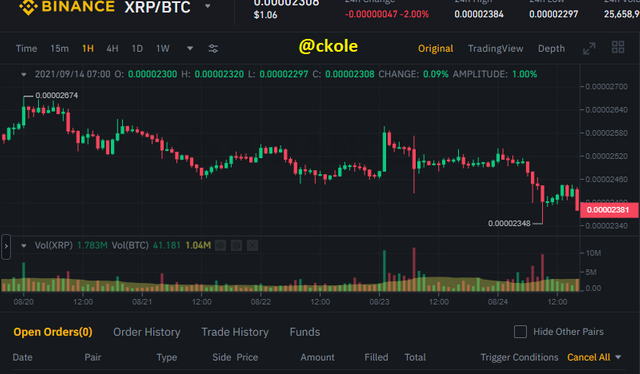
It was understood that when the volume of an asset increases, the price movement goes uptrend, and vice versa, so the volume indicates, the future trend of an asset. Also, the volume indicator is displayed in both vertical and horizontal view. The vertical volume (candle stick) below the chart indicates the volume per candlestick, so a higher volume (candle stick spike) means there are a numerous number of traders transacting at that particular, period, and a low candle, signifies low transaction. Below is a chart showing a volume indicator
.png)
Image source is a screen shot on binance.com
Question 2
Use a platform other than Tradingview to present the volume indicator on a chart and show how to configure its parameters by justifying your choices. (Screenshot required)
I would be using Binance platform for this. Setting up the volume indicator on Binance is all about going to the settings unlike Houbi platform where the volume indicator is a default settings, except you use the tradingview feature for a tweak. I would have preferred using the Houbi exchange but since I would still need to use the tradingview features which is the same settings with trading view itself, I would be using Binance. Though Binance also have trading view features, the original feature has it's indicators of which volume indicator is present
So to configure the volume indicator on Binance,
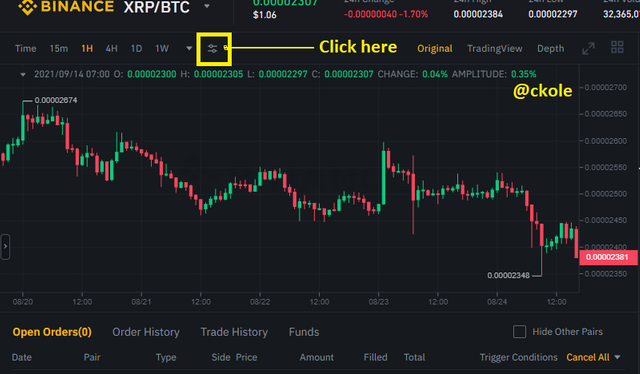
Click on Market and select any pair of crypto asset you wish.
Once the chart is displayed, click the indicators sign as shown below
.png)
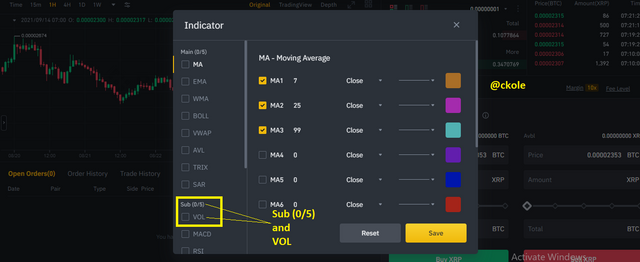
- You would get an image like this, where you can set your preferences. There are various indicators, but all we need here is the volume indicator, so we would need to go down to sub (0/5) on the chart and check/mark the first indicator VOL
.png)
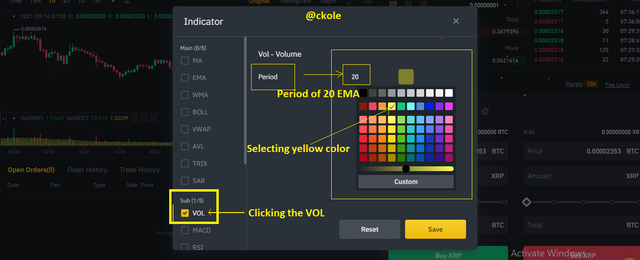
- Immediately after marking or clicking the VOL, there would be changes in the view, and this point, you can type any period and also chooses a color that would reflect your Moving averages of the volume area.
.png)
- When you click the save button, you get something like this below
.png)
See the below chart for chart justification
.png)
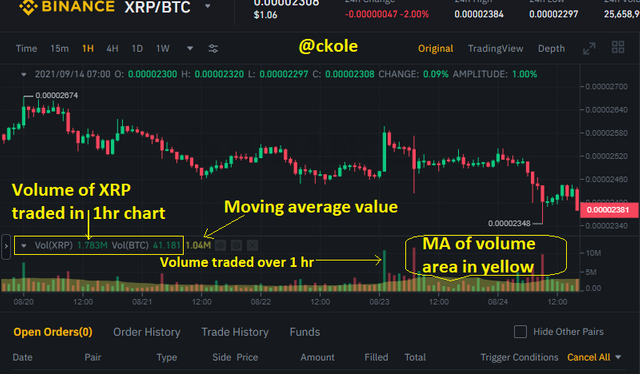
From the chart up, I configured the volume indicator and input a moving average of 20. Because I used 1 hr chart, the volume bar represents the total volume of assets traded for that hour. And the 20 MA I used would calculate the average price over the last 20 volume bars. The green and the red bar indicates high and low volume, which means that the green candles closes at a higher volume while the red closes at a lower volume in the market
Question 3
What is the link between Volume and Trend and How to use volume to predict a trend reversal? (Screenshot required)
When we talk about volume, we are referring to numbers of transactions made within a particular period. This can be classified according to various time frame in the market. And as a matter of fact, the volume transacted determines the movement of the price of an asset. So, in this wise, the volume, affects the trend in either way (bullish, bearish, or consolidation)
The level of the volume of an asset is used as a measurable amount that determines how the price moves in the trends mentioned earlier. The volume level of any asset correlates with the price movement, so by noting the movement of both, we can determine whether the market is going uptrend or in a downward position
When the price of an asset goes up, the volume increases, and when the price starts falling, the volume decreases. That's why we see long and short green candles in the volume chart. It denotes high and low volume in a bullish movement
On the other hand, when the price goes down, the volume would also increase, and when there's a reversal, the candle starts shrinking. If the downward trend continues, the bears are taking the market and the volume should keep increasing as the trend affects the price, and vice versa
Let's see an image to illustrate our point
.png)
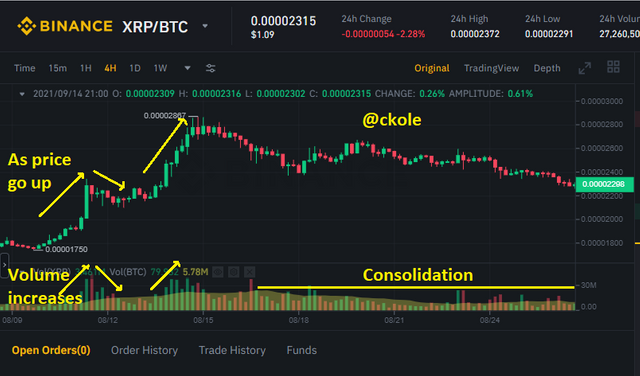
From the image, we can say that the volume established the price because in the bullish trend, the volume goes up as the price shoots higher.
.png)
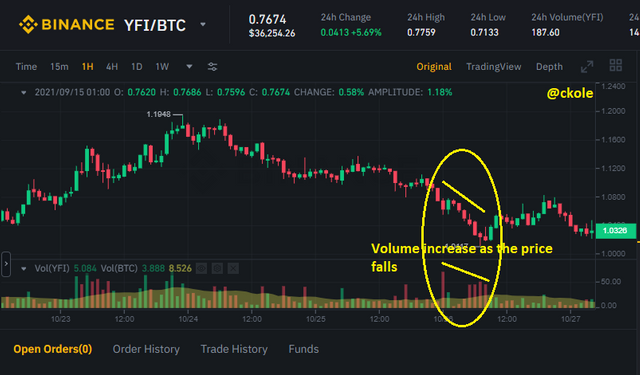
Also, in the down trend, as the price drops, the volume increases.
Question 4
How to use the volume to have a signal confirmation? (Screenshot required)
Identifying the point when the volume would occur is a very important or key thing that can help us to follow the right trend. Once we are able to use volume to confirm signals and where the market is moving, we can profit from such trade.
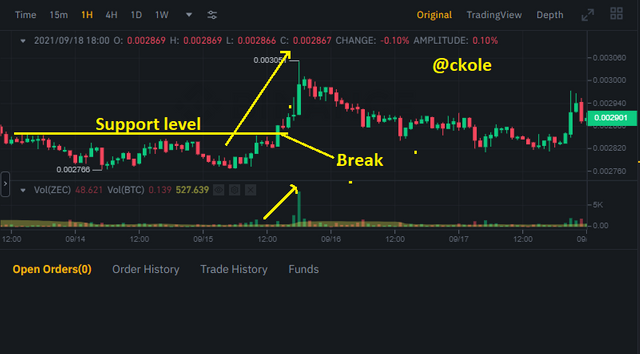
To use the volume to have a signal confirmation, we can focus on the volume chart, and use the EMA as a level where we can watch the progress of the candle sticks. Once the candle breaks the EMA area, we can be sure that the bulls or the bears are taking over rigidly. This signifies strong action of buyers or sellers in the market.
.png)
From the image above, We can see that the volume candle shoot up after various consolidation periods, and that happens after there was a breakout from the support level. So the moment we sight this scenario, we can use it to determine or confirm the direction of the market as a signal confirmation
Question 5
How does the volume reflect the evolution of prices in the charts and why does the volume sometimes anticipate the price? (Screenshot required)
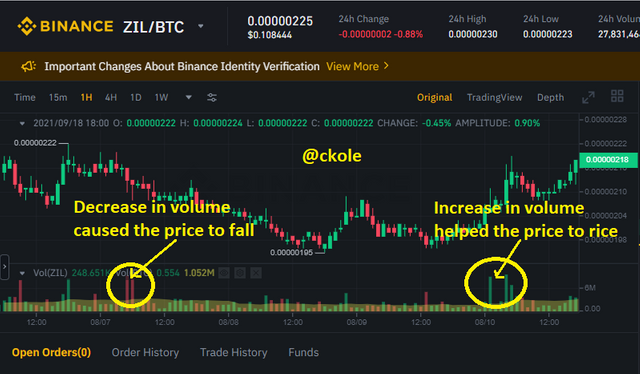
As transactions take place in the market, the volume increases, and when transaction decreases, the volume also decline. So the activities in the market determines the price movement of an asset. If there's much volume, we can be certain that the price of an asset would increase in a bullish trend and vice versa. So the volume shows that price of an asset will rise or fall when the volume goes up and up or comes down. We can really use this to anticipate the price movement of an asset
.png)
From the image above, the volume shows clearly the price movement. The red candles sticks with a bearish spike indicate that the bears are selling and this would affect the price of the asset by falling. On the other hand, the green bullish candles signifies that the bulls are at work. This also affects the market in a bullish way, so we can from here notice that the price of the asset would go up. This is how the volume anticipate or reflect the price movement
Question 6
Is it better to use the volume indicator alone or use it in parallel with another indicator when trading? Justify your answer
There's no 100% self perfect indicator. One indicator compliments the other to arrive at a good point of forecast or market prediction. The volume indicator is a very unique indicator that can be used to determine the price movement of an asset. However, using it with another indicator would make it more effective.
For justification, the moving averages is a very important indicator to use along with the volume indicator in the sense that it shows clearly when the volume is up or down, and also, makes us to know the level of consolidation. This gives us the clue of when to and when not to enter the market. With the MA in place, we can know the volume area and act according to what we see on the chart
Question 7
The volume indicators are multiple, choose one of them to briefly explain its usefulness in crypto trading.
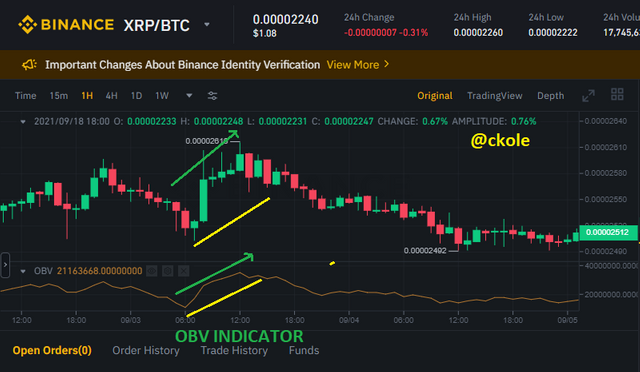
With the OBV, the buying or the selling pressure of an asset in the market can be determined. There's a formula for the OBV
If the current closing price of an asset is higher than the previous closing price, the current price would be added to the previous value, and when the previous closing price is lower than the current one, we subtract the value of the current price from the previous one
.png)
So the OBV is used to predict the price of an asset in advance. The OBV react to the movement of the market. When the big guys pump, the OBV would rise and at that point, we would see a bullish trend in the market, and when there is a dump, and the volume reduces, the OBV would decline
If the OBV is moving in a direction (say uptrend or down trend), we can easily forecast that the price of that asset would keep following the trend at least for a particular period
Conclusion
It's clear that volume is the most important factor in identifying price movement because it precedes price. if there's no trading activities, there can never be any price movement, so it's the volume that triggers market to make it alive by the movement of price up and down. I'm glad to know about the Volume indicator. Thanks to our prof for his wonderful lectures
Thanks for reading
This is ckole the laughing gas.
One love.
Hello @ckole,
Thank you for participating in the 2nd Week Crypto Course in its 4th season and for your efforts to complete the suggested tasks, you deserve an Total|8.5/10 rating, according to the following scale:
My review :
A good job in which you touched on all the questions with interpretation and analysis, with some variation in the effectiveness of the answers. Your reliance on a clear methodology and a good research effort enabled you to succeed in this week.
Thanks again for your effort, and we look forward to reading your next work.
Sincerely,@kouba01
Thank you a great deal prof. I respect your moderation.