Introduction to principles of crypto analysis: crypto Academy S4W7|| homework post for @imagen

THE DIFFERENCE BETWEEN FUNDAMENTAL ANALYSIS AND TECHNICAL ANALYSIS
Ordinarily, fundamental analysis is a method used to determine the real market value and the fair market value of a stock. In crypto trading a fundamental analysis is simply the methodology traders employ to be able to analyze the cryptocurrency market.
The essence of carrying out a fundamental analysis on crypto currency is owing to the volatility acquainted to it. The cryptocurrency trading is very risky and this can be seen from the constant fluctuation in its price but the risky part of it can be lessened relying on fundamental analysis.
Fundamental analysis is a concept that defeats the idealogy that crypto market can either overvalue or undervalue an asset. Because traders get to determine whether an asset is overvalued or undervalue by there decisions overtime. So, by virtue of running a fundamental analysis, investors get insight to purchase undervalued stock and stay away from overvalued stocks. In that way, they avoid the risky part of trading.
Additionally, the crytocurrency market is an unregulated one even though fast growing day by day with lots of cryptocurrencies emerging everyday and over thousands of it has fails already. All these factors are simply pointing to the fact that movement in the crypto market can be misleading and most atimes risky but all thanks to fundamental analysis which from time to time offers more trustworthy information in the market.
The value of crypto changes very swiftly hence, investors buying an undervalued crypto asset could afford him reasonable profits. while investing the other way round could be very disastrous to the investors. So, the cryptocurrency fundamental analysis guides the investors to identify and distinguish the difference between these two concepts.
Running a fundamental analysis is a complex process for beginners as the investors in analyzing an asset will have to determine the real value of an asset by considering the internal and external factors surrounding the said asset and then compare it to its market value. so in this way, if the current market value is below real value of the asset, the trader can go ahead with his investment with the hope of making considerable profit in due time.
Here are some of the advantages of fundamental analysis.
first of all running a fundamental analysis gives you a hint about what the fate of the market in a short term. so, volatility and short term price movement can only be forecasted using a fundamental analysis.
A perfect understanding of fundamental analysis is the best tool traders need to determine the best moment to enter and exit the market.
Technical Analysis
This is simply the application of statistical and mathematical modelling in studying price movement in the stock market which helps investors make sounder investments. So, all the trader needs to do is to look at the trend and pattern of the market as well as predict the next price move by analysing the market historical data which is the price and volume.
Also, considering the rate of volatility associated with cryptocurrency, there comes a need to employ a given strategy that would serve as a guide in the trading and technical Analysis happens to be the strategy most investors turn to. With this type of analysis, traders get insight into the past price movement of a particular crypto asset which help them predict the future of the asset.
Basically, running technical analysis requires the use of trend and chart patterns, support and resistance levels, volume behavior and prices to determine major trading opportunities but patterns are basis for technical Analysis. These pattern are the price movement on the chart replicated by a Japanese candlesticks. Hence, every other tool that technical analysis employ begins and ends with price patterns. This is because the basic information the analyst needs to gain is embedded on the candlestick charts; I will explain:
Firstly, the trader relies on the candlestick chart to see how the asset in question is performing so as to make his predictions for the future. And if for instance, the wick of the candle is long, this is simply an indication of high volatility meaning there could either be significant losses or gains incurred from the asset in the relevant period. But if the wick is short, it is simply an indication of potential change in the market. So, whatever be the pattern gives the slightest clue of what predictions the trader could make.
Now the trend lines: This is another element of technical Analysis that investors learn which indicates the direction an asset will take. Trendline can either go up or down or even sideways. In addition to these three moves there is also such a thing integrated trendline which most trading software include. This gives the investors an opportunity to place his or her own trendline with a reasonable degree of accuracy. So the level of accuracy of the traders predictions is partially determined by the accuracy of those trendline.
Next is the support and resistance levels. This is another concept the investor needs to understand in technical analysis. The both concepts are represented with horizontal lines which is drawn on the trading chart to gain insight into the market. So while the support level is the point where demand is high because of the asset low price. It is at this point that investors want to acquire as many crypto as possible. The resistance level is the opposite in that there is usually heavy supply over demand at This point. So, breakout of resistance and support level are also included in our technical Analysis which is used to determine the strength of the current trend per time.
There is yet another tool which is trading volumes. Taking a glance at the trading volumes of a particular asset helps determine the significance of a trend. If the trading volume of an asset is high , it is an indication of a significant trend while low trading volume is an indication of a weak trend which may not last long.
Again, we have market capitalization which gives a clue of a coins stability using technical analysis. with this, the investors get to understand that asset with larger market caps has the capability to be more stable than the other way round.
Which is most often used?
Whether technical analysis or fundamental Analysis whichever that is been used or mostly used is dependent on the traders strategy or time frame. So, that being said, fundamental analysis is mostly used in short term investment because within the period of few minutes to a day, the technical analysis of support and resistance level has the tendency of influencing a price direction hugely.
CHOOSE OF THE FOLLOWING ASSET AND PERFORM A FUNDAMENTAL ANALYSIS INDICATING THE OBJECTIVE OF THE PROJECT FINANCIAL CARDANO ($ADA)
Firstly cardano is the decentralized proof of state blockchain with verifiable smart contract developed by Charles Hoskinson in the year 2015 and the platform was launched in 2017. The Cardano token was created with the objective of building a decentralized and connected system as well as facilitating banking services for the unbanked.
Cardano (ADA) is one of the fastest growing blockchain crypto in the cryptocurrency industry as at this very moment being listed as a top 10 cryptocurrency in coinmarketcap. It is the likes ETH when it comes to building a huge blockchain ecosystem as its technology advance at a very rapid velocity.
Far from being a digital currency used for storing value, receiving funds and sending funds, the token runs on a decentralized network which in turn creates protocols and DAPPS. And this sponsors its very ability to receive or send funds instantly on the minimal charge since it has application in finance and business world.
Cardona aims to solve most current problem in the blockchain industry which includes but is not limited to:
using mathematics to build a secured blockchain that has lower risk of data hacks and attacks.
bridge the accounting and computational layer.
A more scalable consensus machanism and a secured voting mechanism for crypto holders.
Basically cardano blockchain has two components:
The first one is Cardano** settlement layer (CSL)** this is where cardano (ADA) holders receive and send ADA on a moderate transaction fee.
The second one is Cardano computational layer (CCL) this protocol aids in running smart contract, ensuring security and some other functionality like identity recognition.
Financial metrics
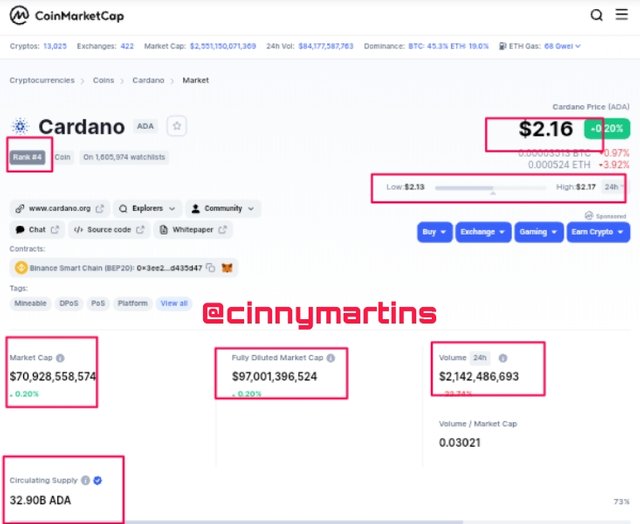
To run this Analysis I relied on coinmarketcap and considered some feature of cardano which includes it market capitalization, circulating supply, volume etc
From coinmarketcap, cardano (ADA) has the following parameters:
Price at $2.16
Ranking 4
Market cap of $ 70, 928, 558, 574
Circulating supply of 32, 90B ADA.
Fully diluted market cap of $97,001,596,525
24h volume of $2,142,486,693
24h low/high is $2.13/$2.17
MAKE A PURCHASE FROM YOUR VERIFIED ACCOUNT OF AT LEAST 10 USD OF THE CURRENCY SELECTED IN THE PREVIOUS POINT. DESCRIBE THE PROCESS. (SHOW SCREENSHOTS).
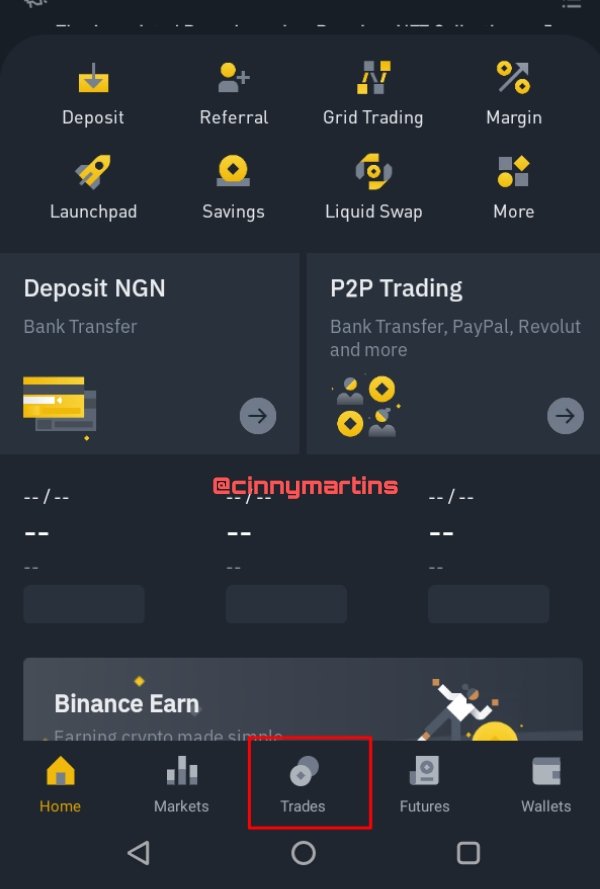
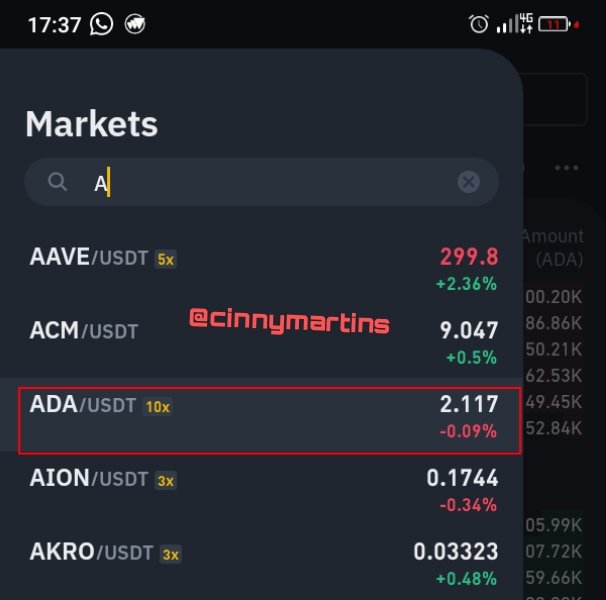
For this task, I choose to work with my binance exchange and the first thing I did was click on trades from the exchange homepage.
The trade page opened up and as set by default it was on BTC/USDT so I clicked on the path where my arrow points and make my pair choice.
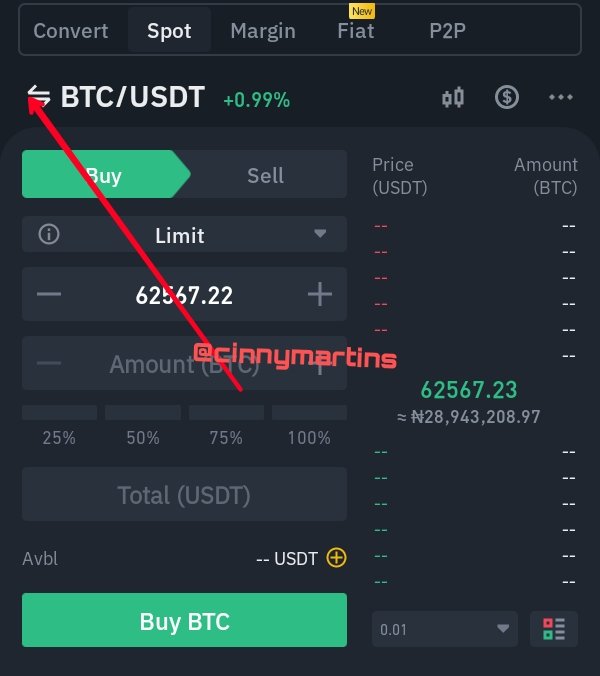
Right there is a search bar where I quickly typed in the coin I wanted which is ADA and it showed up so I clicked on it.
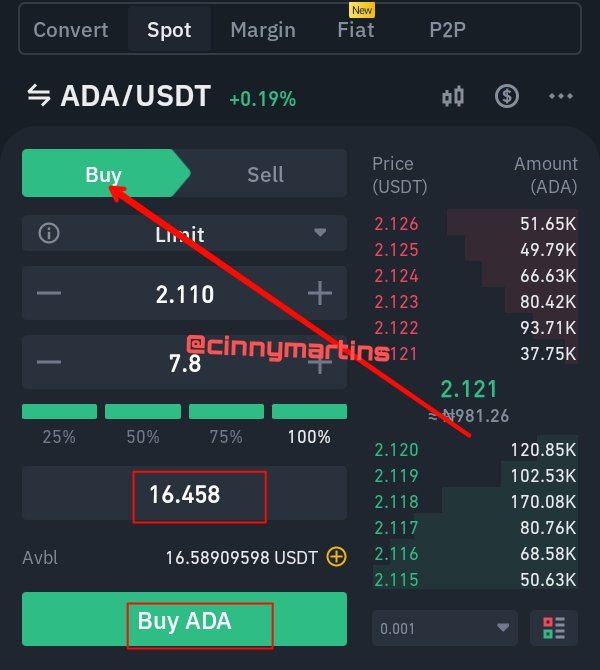
And here I have it on my trade page. So with my USDT worth over $16, I placed a buy order for ADA against USDT and clicked on buy.
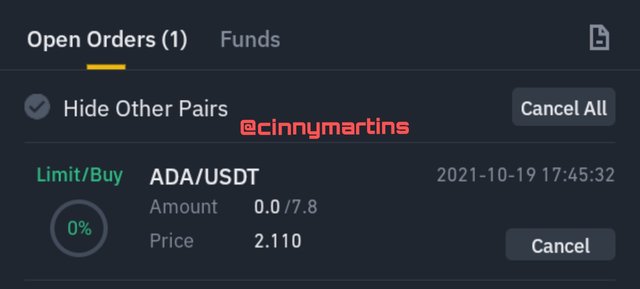
Here is the details of my order waiting to be executed.
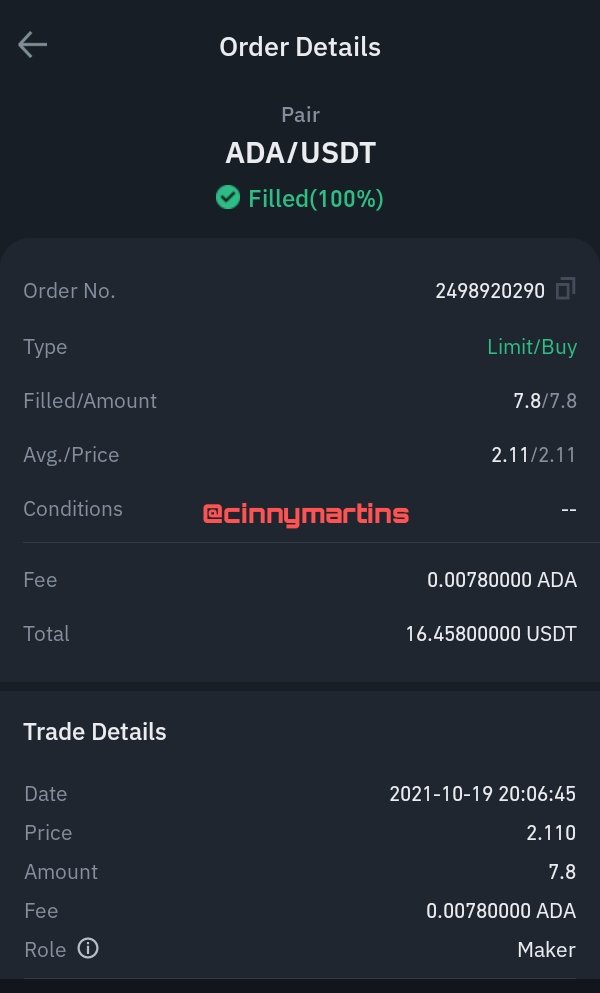
And I have my order filled and executed here as well as the details of the whole transaction.
APPLY FIBONACCI RETRACEMENT TO THE PREVIOUSLY SELECTED ASSET with a 4-hour TIME FRAME ON THE PLATFORM OF YOUR CHOICE. OBSERVE THE EVOLUTION OF THE PRICE at 24 and 48 HOURS, DID IT GO UP OR DOWN in VALUE? LOOK TO IDENTIFY RESISTANCE AND support LEVELS. (SHOW SCREENSHOTS at 0, 24, AND 48 HOURS of PURCHASE WHERE THE DATE AND TIME ARE OBSERVED).
I choose to carry out this task with Tradingview platform on a 4hrs Chart of ADA/TetherUS
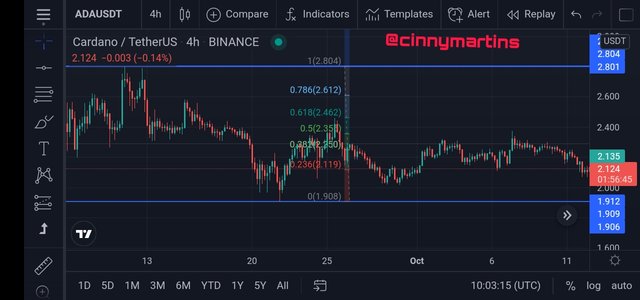
I identified the possible resistance and support level from which the support level is 0.618 and the resistance at 0 line. The least point in a bullish move is authenticated if it aligns with 1 or 100% margin and conversely, the least point in a downward move will be valid if it aligns with 0% margin.
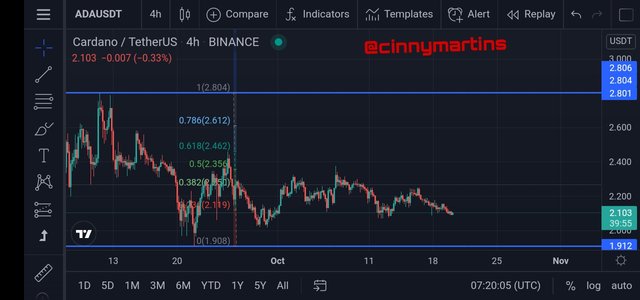
The chart here is running on a 24hrs time range with the resistance and support level identified.
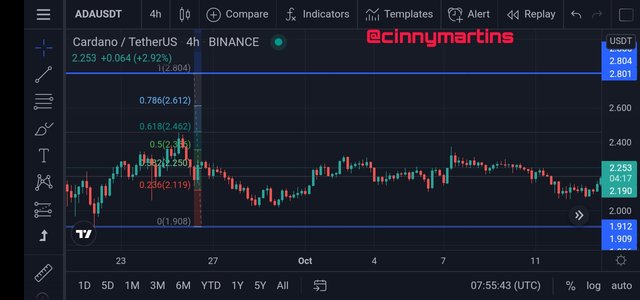
Here on 48hrs time range and as per whether there is any change in price, all I can say is that price only seem to be taking a downward move slightly.
WHAT ARE BOLLINGER BANDS? HOW DO THEY APPLY TO CRYPTO TECHNICAL ANALYSIS? WITH WHICH OTHER TOOL OR INDICATOR DO YOU COMBINE BOLLINGER BANDS TO ANALYZE A CRYPTO? JUSTIFY YOUR ANSWER.
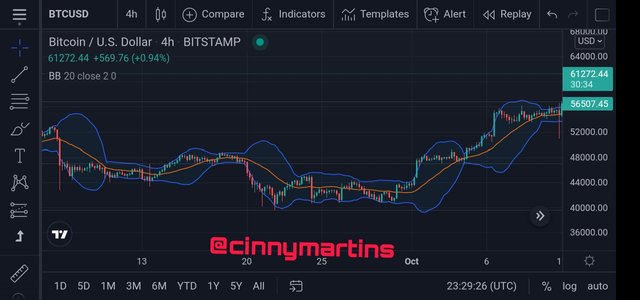
First of all, Bollinger bands are 3 line volatility based indicator used in predicting price movement of an asset per time. The 3 lines in between the chart is called bands and they all have different significance although the upper and lower band are used to identify the strength of trends.
Based on the movement of these trends the trader strategizes to make his trading decisions as to entry and exit point in the market.
The trend here is either bullish or bearish. When it is bullish, the trend takes a consistent upward move with series of higher highs towards the upper bands. It shows that buyers have taken over the market and indicates market possible reversal. While in the bearish trend, the trend keeps moving downwards indicating that sellers are in charge in the market.
The Bollinger band is used to indicate when the market is in its Overbought it oversold region. The price sways between the upper and lower bands when the trend is sideways and if the price is found below the lower band which is the oversold region, it indicates time to buy an asset but if the price goes above the upper band which is the Overbought region, it points a sell entry.
Which other indicator do you combine with Bollinger band to analyze crypto?
RELATIVE STRENGTH INDEX
RSI is technical indicator employed to carry out analysis in financial markets. This indicator is basically used to display the current and historical strength of an asset on the chart by relying on the closing price of the asset for a particular period of time. With this indicator, traders can easily ascertain the peak of recent price changes so as to evaluate the overbought and oversold region of an asset.
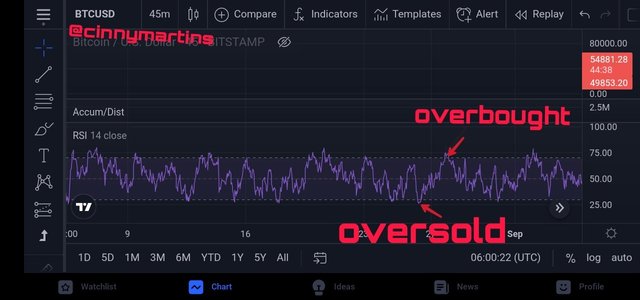
The RSI indicator is ranged from 0-100. And according to traditional usage of RSI, the range of 70 and above suggests that an asset Is becoming overbought hence, an indication of a price reversal while RSI ranging from 30 downward is an indication that an asset is becoming oversold. In other words, whenever the RSI indicator surpasses the horizontal line range of 30, it signifies a bullish trend but when it is below the horizontal range of 70, it indicate a bearish sign.
So, from the image above, the overbought region is captured at 73% and afterwards comes a bearish move while the oversold region is captured at 29% after which the bullish trend too off.
The price trend and the RSI indicator is partially related in the sense that whenever the price trend downwards, the RSI hits the oversold region and it is at this point that investors tend to acquire as many asset as possible in anticipation of a possible price reversal towards the bullish end.
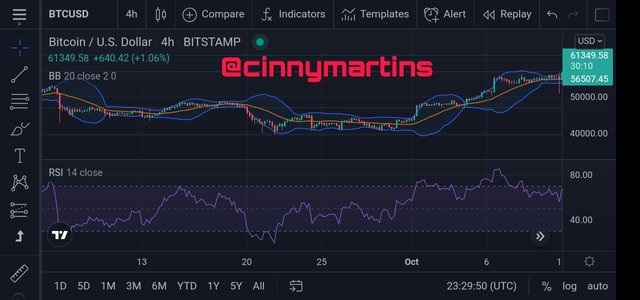
From this image now, it appears the RSI replicates the exact moves of the Bollinger bands with both indicating when there is an upward trend and a downward trend this speaks of the compatibility of the two indicators.
Thanks and best regards sir.
Gracias por participar en la Cuarta Temporada de la Steemit Crypto Academy.
Continua esforzandote, espero seguir corrigiendo tus asignaciones.