Steemit Crypto Academy Season 3| week4: Trading the Dynamic Support and Resistance| Homework task for @cryptokraze
Homework: Trading The Dynamic Support & Resistance
Professor @cryptokraze.
Written by @chinma
In the previous assignment we discussed a little bit about support and resistance, support which shows a region of that has been oversold and ready and to start buying, while resistance is a point that shows overbought and time for sellers to take over the market. Support also shows a point or region where the price has been stopping due to some factors that has happened for more than two times.
Support can the synonymous to the floor of a house while resistance is the opposite of the support in terms of the location which takes the upper the side. The resistance is synonymous to the roof of the house. And if you noticed, the resistance and the support were all in a straight line, which is called a static support/resistance.

1. What do you understand about the Concept of Dynamic Support and Resistance? Give Chart Examples from Crypto Assets.
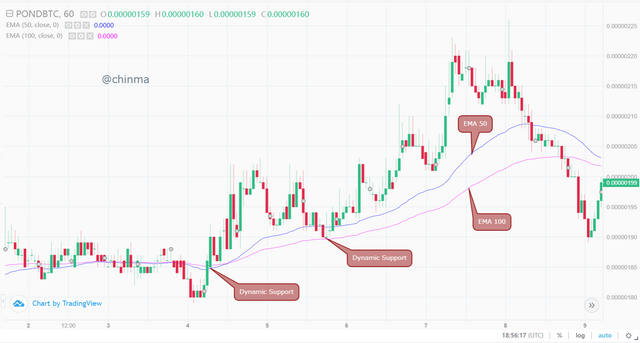
Dynamic support also has the same function with the static support but the difference is in their location/position of the support line. Dynamic Support always forms a trend either upward trend or downward trend. As the name implies, it is a moving or evolving support. It is not determined with a straight horizontal line or even a vertical line but either a trend line or you can use moving averages to determine in a market structure.
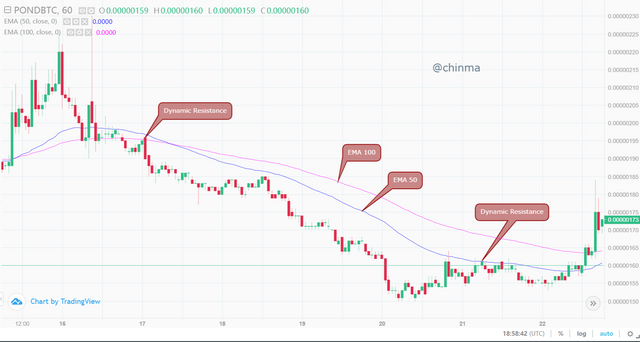
Dynamic Resistance, as earlier been said in Dynamic support, these are evolving or moving resistance in respect to the price of the market. They are point in the market that signifies over sold and the trader that it is time to buy but they are not straight like the static resistance. Dynamic resistance usually forms a trend either upwards trend or downward trend. They can be gotten using either trend line or move averages. And example can be seen below.
2. Make a combination of Two different EMAs other than 50 and 100 and show them on Crypto charts as Support and Resistance.
Firstly, what is EMA? It stands for Exponential Moving Average. This is a type of technical indicator in the trading market that helps to determine the average price per group of period exponentially before a price moves. It is a type of moving average. The EMA is a lagging indictor. EMA is advantageous to more recent price action.
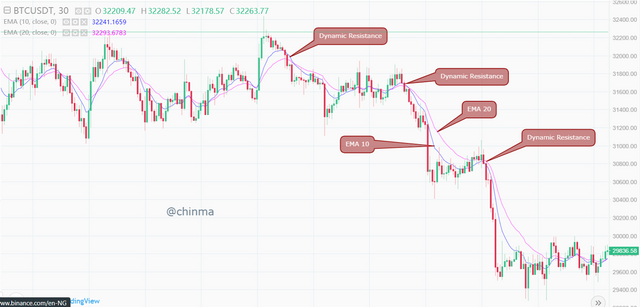
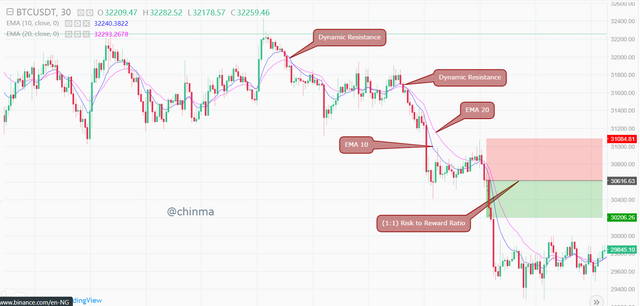
We have done a little justice to the EMA, now if you look closely at the image below, the EMA is selected to determine a Dynamic Resistance, with a period of 10 and 20 you can also find the Dynamic resistance of the trade.
In the chart below, we can see the chart observes resistance at point it touches the EMA and goes back down in the downtrend.
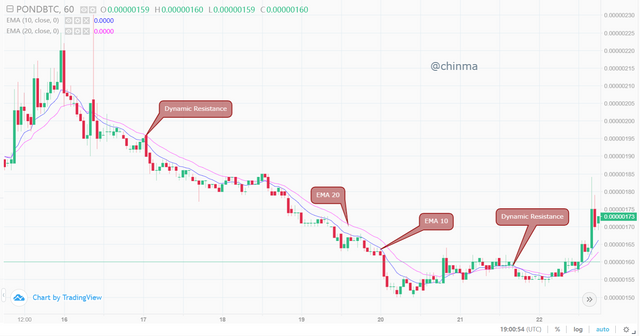
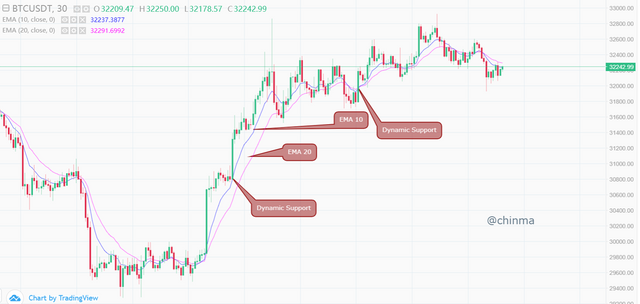
Both EMAs serve as supports at different levels in an upward or downward trend. The EMA 10 serves as the first the support or as it can be called a minor support but the EMA 20 serves as the major support, if the price breaks through the EMA 20, it might totally reverse the direction of the price depending on the time frame use.
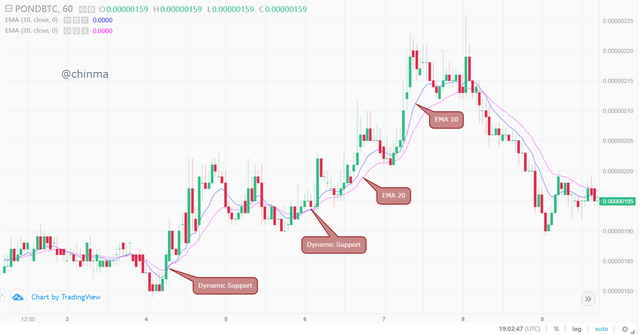
In the chart above Dynamic Support that was formed using EMA 10 while as price breaks the EMA 20, it sees a reversal into a new trend.
3. Explain Trade Entry and Exit Criteria for both Buy and Sell Positions using dynamic support and resistance on any Crypto Asset using any time frame of your choice
The Entry criteria
For Buying using the Dynamic support
• Firstly, you should know that dynamic support works on trending market
• Then set up the EMAs which are 10 and 20 respectively,
• If the price moves downwards and touches the EMA 10
• At this point the EMA serves a support,
• You should wait for a reversal, then you can execute the buy order
• Secondly, if the EMA 10 crosses the EMA 20 moving upwards.
• You can also execute a buy order.
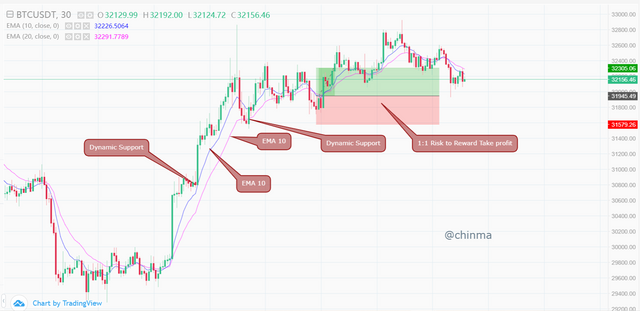
• Ensure to put your risk to reward ratio which will determine your stop loss and take profit.
For Selling using the Dynamic Resistance
• Set up your EMAs, which are 10 and 20 respectively
• Look for a trending market
• Allow the price to hit the EMA 10 or 20 which serves as a resistance at this point
• Once the price bounces on the resistance
• If it moves downwards, execute a sell order
• You can also execute a sell order, when the EMA 10 crosses the EMA 20 and they are both moving downwards.
• Ensure to set your risk to reward ratio, which is 1:1.
The Exit criteria
To Exit Buying using the Dynamic support
• After executing the buy order
• You can use the previous highest point as your take profit to exit the trade
• You can also use the risk to reward ratio, which is 1:1
• You can also exit the trade if the EMAs crosses each order and move to the opposite direction
To Exit Selling using the Dynamic Resistance
• After executing your sell order
• You can exit manually
• You can also exit the trade if the price has reached the previous lowest point
• Or you can also set your risks to rewards ratio as 1:1.
• If EMA 10 crosses EMA 20, you should exit the trade
•
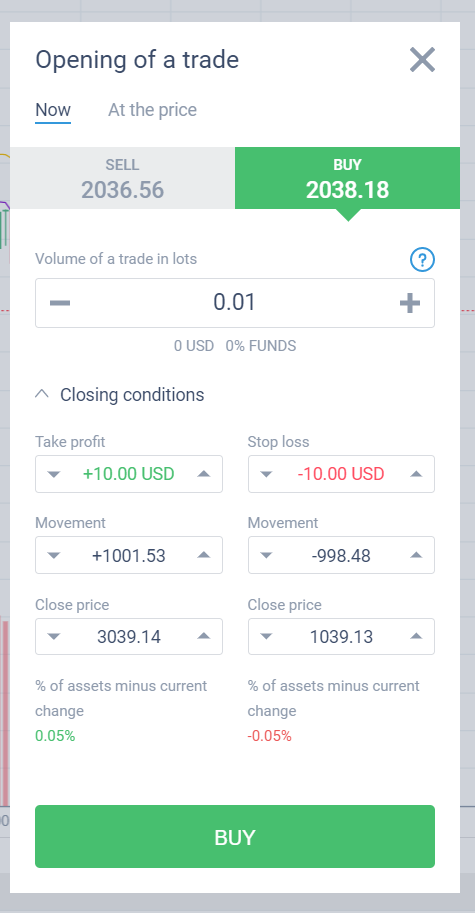
4. Place 2 demo trades on crypto assets using Dynamic Support and Resistance strategy. You can use lower timeframe for these demo trades
Using lifeforex, a cryptocurrency and forex broker I was able place trades on the LTC/BTC and and ETH/USD using the 15 minutes timeframes.
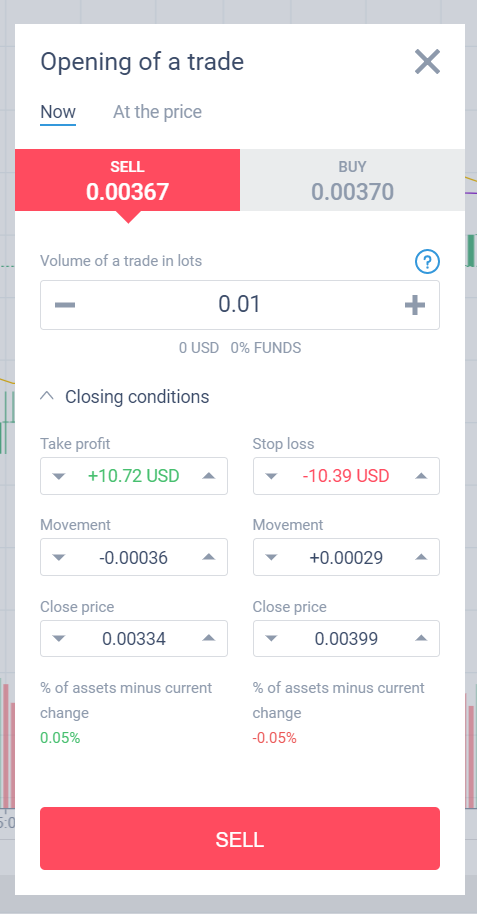
First Demo Trade
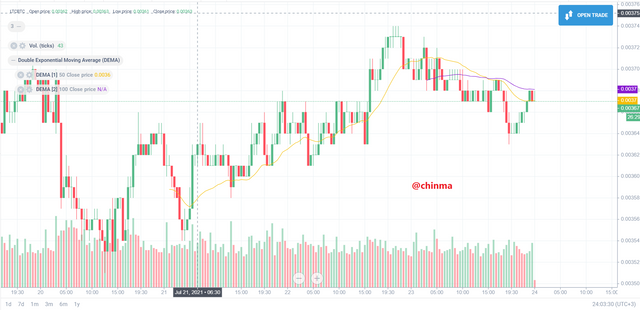
I make the LTC/BTC Sell trade at 0.0037 as the price meets the EMA 50 retracing back down. I place my stop loss and take profits 10 pips away observing (1:1) Risk to Reward Ratio.
Second Demo Trade
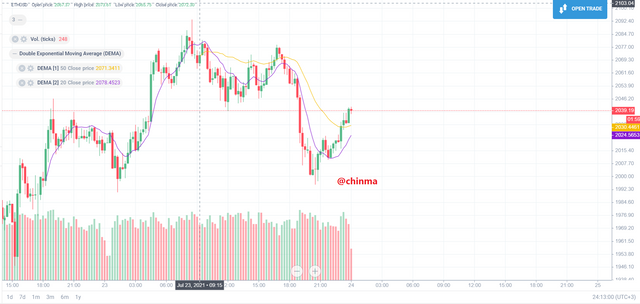
Making the ETH/BTC Buy trade at 0.0037 as the price goes a little above the EMA 50 . I place my stop loss and take profits 10 pips away observing (1:1) Risk to Reward Ratio.
Having understood properly Dynamic Support and Resistance, I Understood why techinical analysis seems like learning ancient greek to newbie traders.
Price is sometimes in a dynamic support and resistance, like a flowing stream hitting the edges of the earth only to flow back down along it's path.
Thanks CC. @cryptokraze
Dear @chinma
Thank you for participating in Steemit Crypto Academy Season 03 and making efforts to complete the homework task. You got 8/10 Grade Points according to the following Scale;
Key Notes:
We appreciate your efforts in Crypto academy and look forward for your next homework tasks.
Regards
@cryptokraze