Introduction to the principle of crypto analysis - Crypto Academy / S4W7 - Homework Post for @imagen
1. What are the differences between Fundamental Analysis and Technical analysis? Which one is used most often?

Fundamental Analysis:
Fundamental analysis (FA) is a method of analysis used to determine the intrinsic value of a stock or asset by studying or evaluating information from both internal and external sources. Fundamental analysis studies both the past and present behaviour of the market and factors that are affecting the market in order to predict the future consequences.
Technical Analysis:
Technical analysis is a form of analysis that involves the studying of charts and patterns of price movements to make effective predictions of future price movements. Here, traders study’s candlestick patterns and market behaviour of the movement of price in the past to predict its behaviour in the future with the help of other technical indicators and trendlines.
Fundamental analysis VS Technical analysis
Fundamental analysis:
• Fundamental analysis is more significant and reliable for long term investments.
• Fundamental analysis is used to calculate the intrinsic value of a stock, utilizing internal and external data and factors including past and present information.
• Fundamental analysis is used to evaluate the value of stock in order to make effective trading decisions.
Technical analysis:
• Technical analysis is more reliable for short term traders.
• Technical analyst study’s past price pattern or movement to help in effective decision making.
• Technical analysis involves the use of candlestick patterns, trends and charts to make good trading decisions.
2. Choose one of the following crypto assets and perform a fundamental analysis indicating the objective of the project, financial metrics, and On-chain metrics.

Cardano (ADA)

Bitcoin News
Cardano (ADA) is a blockchain platform available for the public to carry out crypto transactions, it was founded in 2015 by Charles Hoskinson.
Objective:
The objective of Cardano is to build a future or environment that promotes peace and trust among people and to provide worldwide solutions to global problems. Cardano seeks to give businesses the space or opportunity to grow independently, it also creates room for people and the society to strive towards a pure democratic nature, self-governance, fairness and accountability.
Intotheblock
Financial Metrics:
This is the number of a Cardano (ADA) in circulation times the price.
| Yardstick | Value |
|---|---|
| Market Cap | 32.9B x $2.1277 = $70 Billion |
| Trading Volume | 2,736,178,442.39 |
| Liquidity: from the trading volume, it is obvious that ADA can be easily converted to other cryptocurrencies or Fiat money | 1 ADA = $2.1277 |
| Circulating supply | 32,904,527,669 ADA |
| Total supply | 33,250,650,235 ADA |
| Maximum supply | 45,000,000,000 ADA |
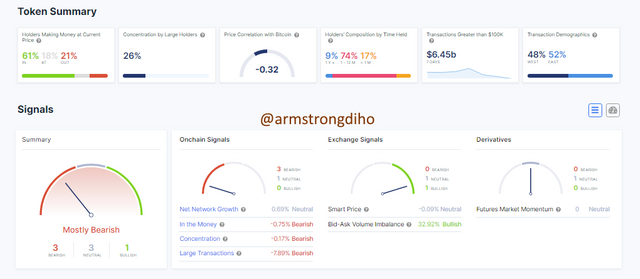
On-Chain Metrics of Cardano (ADA)
| Yardstick | Value |
|---|---|
| Number of transactions carried out | 1,000,000 |
| Number of wallets created | 1,000,000 |
| Hash Rate | 10,094 per day |
| Volumes locked in staking | 1,077,716 |
| Volumes deposited in exchanges | 170.48 Million |
3.) Make a purchase from your verified account of at least 10 USD of the currency selected in the previous point. Describe the process.
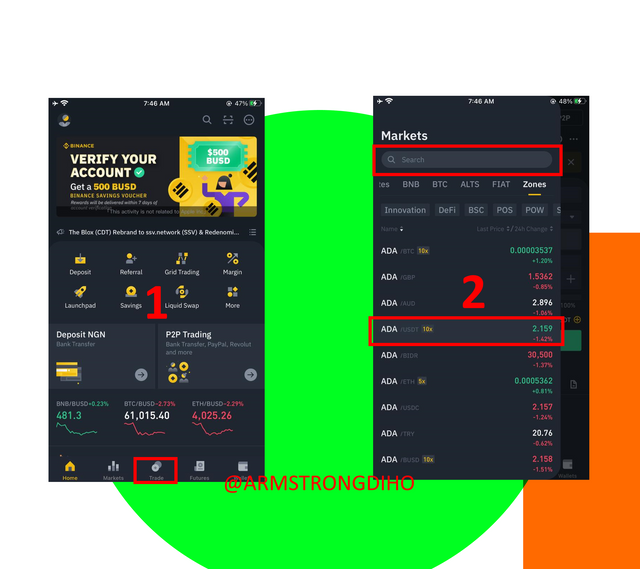
To make a purchase of ADA the native currency for Cardano, simply do the following:
- From your verified exchange account, visit the trading area as shown below in [1], thereafter, search for ADA/USDT (or ADA/your preferred medium of exchange - BTC, ETH, etc.) as shown in [2].
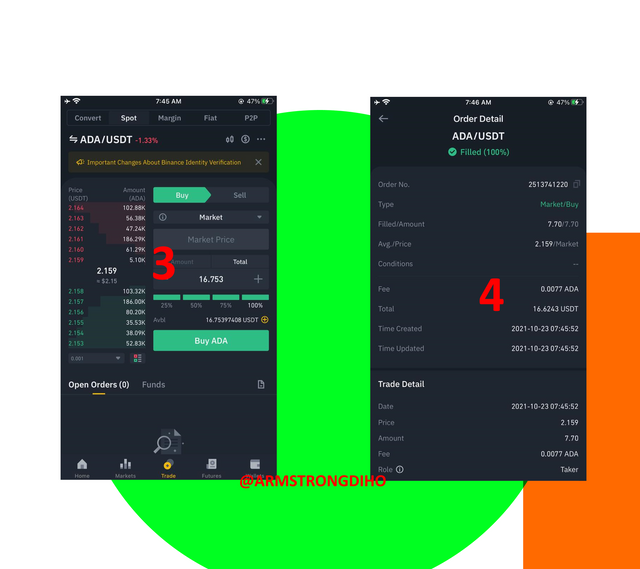
Next, proceed to enter your required amount of ADA on the input areas provided as shown in [3], (alternatively, you can enter the USDT worth of ADA you intend to purchase).
After entering the required fields, simple click on Buy ADA to complete the transaction. Here is the detail of the successful transaction shown in [4]. As evident from the screenshot, we purchased 0.0077ADA worth 16.6243USDT.
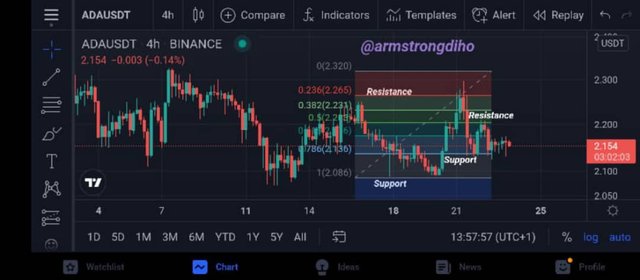
Apply Fibonacci retracements to the previously selected asset with a 4hr time frame on the platform of your choice. Observe the Evolution of the price at 24 and 48hrs, did it go up or down in value? Look to identify resistance and support levels. (Show screenshots at 0,24,48 hrs of purchase where the date and time are observed)
I used my Binance app to answer this question. I looked for the direction of the trend and then applied the Fibonacci retracement for 4hrs. For a downtrend, the Fibonacci reading starts from up, while for an uptrend, its reading starts from down. I applied my support and resistance levels as seen below.
5. What are Bollinger Bands? How do they apply to crypto technical analysis? With which other tool or indicator do you combine Bollinger Bands to analyze crypto? Justify your answer.
Bollinger Band
During the 1980s John Bollinger formulated a method of identifying the price and volatility of a market known as ‘Bollinger Bands’. The Bollinger bands consist of a moving average of N-period which is the middle band, and an upper and lower band. The Bollinger band is used to initiate buy and sell signals in a trending market.
How to apply the Bollinger Bands to Crypto technical analysis
The Bollinger Bands consist of three lines, the upper line, the middle line, and the bottom or lower line. The upper band is known as the upper resistance line. While the lower band is the lower support line. The middle line is usually an exponential moving average of 20 days. The use of the Bollinger band varies for traders. Some traders buy when the price touches the upper Bollinger Band and Sell when the price touches the lower Bollinger Band while others Sell when the price touches the upper band and buy when the price touches the lower Bollinger band.
ADX and Bollinger Bands
an Average Directional Moving Index [ADX] is a lagging indicator used to analyze the strength of a trend. It consists of two directional indexes, the positive directional index +DI and the Negative Directional Index -DI. Its value ranges from 0-100. A range from 0-20 shows that the trend is weak, a range from 25-40 shows that the trend is strong, a range from 40-100 shows that the trend is extremely strong. Traders have developed various strategies on when to buy and when to sell over the years.
However, analysts consider it a buy signal when the +DI is above the -DI (negative Directional Index), and a sell signal when the -DI is above the +DI (positive Directional Index). Using the Average Directional Index as an auxiliary indicator will help investors confirm signals generated by the Bollinger Bands.
A market of 0-20 ADX shows that the trend is weak and when the price patterns are formed along with the Upper or Lower Bollinger bands it means that there will be a reversal. When the ADX of the market is 25 or above it means that the market is trending and when it hits the Upper or Lower Bollinger Bands there might be a reversal. Some traders decide to buy when the ADX is below 20 and the trend is on the Lower Bollinger Band and sell when the trend is on the Upper Bollinger Band.
.png)
FX Trading Revolution
Conclusion
Success as a trade lies in the ability to apply basic trading principles. Fundamental and technical analyses are done to help traders and investors make good choices and increase their chances of making money from the market. These and other principles must not be neglected or a trader inadvertently places his/her financial resources at risk.
THANKS FOR READING THROUGH
CC;
@imagen
Gracias por participar en la Cuarta Temporada de la Steemit Crypto Academy.
Continua esforzandote, espero seguir corrigiendo tus asignaciones.