Crypto Academy / season 4 week 4 - Homework Post For [@kouba01]- williams %R indicator.
Hello everyone hope you all are fine and safe. Today i attend one more lecture by @kouba01 in which i learn about williams %R indicator. Now i am going to submit my homework post for this lecture. Let's start.
INTRODUCTION
As we all know there are lot of new as well as old traders who are investing their money in Crypto. Lot of traders got profit and make a huge amount of money from crypto. This earning and investing in crypto is not easy just putting money and getting profit. In crypto world lot of traders lost their savings i also lost some money in the begging. Why this happen because we didn't have knowledge about about investment. So every trader must have good knowledge before investment. He should know about graphs, strategies and many more then he will be able to get profit. There are lot of indicators which our professors teach us. Same williams %R indicator will help every trader in his investment and makes its capital to some extend risk free and loss free.
Explain the Williams %R indicator by introducing how it is calculated, how it works? And what is the best setting? With justification for your choice.
Williams %R indicator or we can simply call it as %R indicator. Williams %R indicator was developed by Larry Williams. Larry Williams was an technical analyst he developed this indiactor so that traders make right decisions associated with their trading and earn profit. Williams %R indicator is a momentum indicator and moves between 0 to -100 this is its range. Its construction is similar to Stochastics oscillator about which you may know. Williams %R indicator compares closing price of any coin to its high to low range over a specified period of time. The normal time is fourteen days in dialy charts.
Williams %R indicator tells us lot of things about the market. It gives us information about the strength or weakness of market, also used to identity overbought and over sold levels. What does overbought and oversold mean here is important to know, overbought means that the price of coin is near the highs of its recent range and oversold is its inverse that means the price is near the botton side of its recent range. Professor have discussed this in past with full detail. Williams %R indicator gives us trade signals but it is best to use it with other indicators that will give better results.
Williams %R indicator gives trader a clear signal where to take entry(buy) or take exit(sell) from any coin. As we know if trader has good entry and exit he will get maximum profit and minimise loss.
Calculations of Williams %R indicator
Calculating Williams %R indicator is done by one formula which is given below. This calculation is not now required that much as this work is now done by trading platforms or softwares for easy our work. Still knowing calculation of this indicator will increase knowledge of this indicator for trader.
Williams %R indicator= (HIGHEST High- Close) / (Highest high - lowest low)
In the above formula / represents divided by or division.
Highest high :- Highest price of coin in look back period
Lowest low:- lowest price of coin in look back period
Close:- Most recent closing price
The look back period is typically 14.
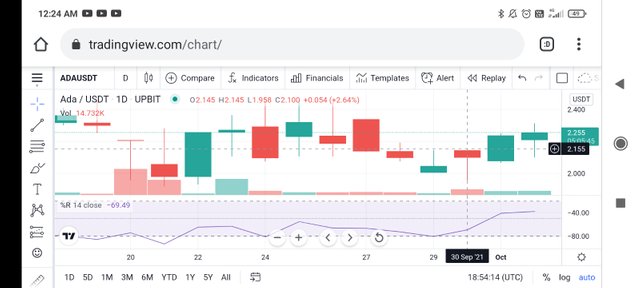
This is the image from where we can calculate Williams %R. The Williams %R are given at each point and same comes from the formula.
Best settings for Williams %R indicator
The most and commonly using setting regarding time is 14 periods. These periods may be days , weeks, years and even minutes. We have to see the upper lower and closing time and check the %R value. These things depend upon the trader.if trader is going for a long trade definitely he will go for weeks period or even year and if trader wants a short trade he will see days period. It is good to see day period because in short periods there is tough to see highs and lows as there is not too much difference and also that didn't impact that much. So its upto trader which trade he is doing short or long. If short we will go smaller time periods and if long he will go for long period. But best is 14 days periods.
working of Williams %R indicator
Like other momentum oscillators the Williams %R indicator appears below the price chart. The middle line for this indicator is -50 above this indicates price is moving up trend and below and the reading near -100 is oversold.
How do you interpret overbought and oversold signals with The Williams %R indicator when trading cryptocurrencies? (screenshot required)
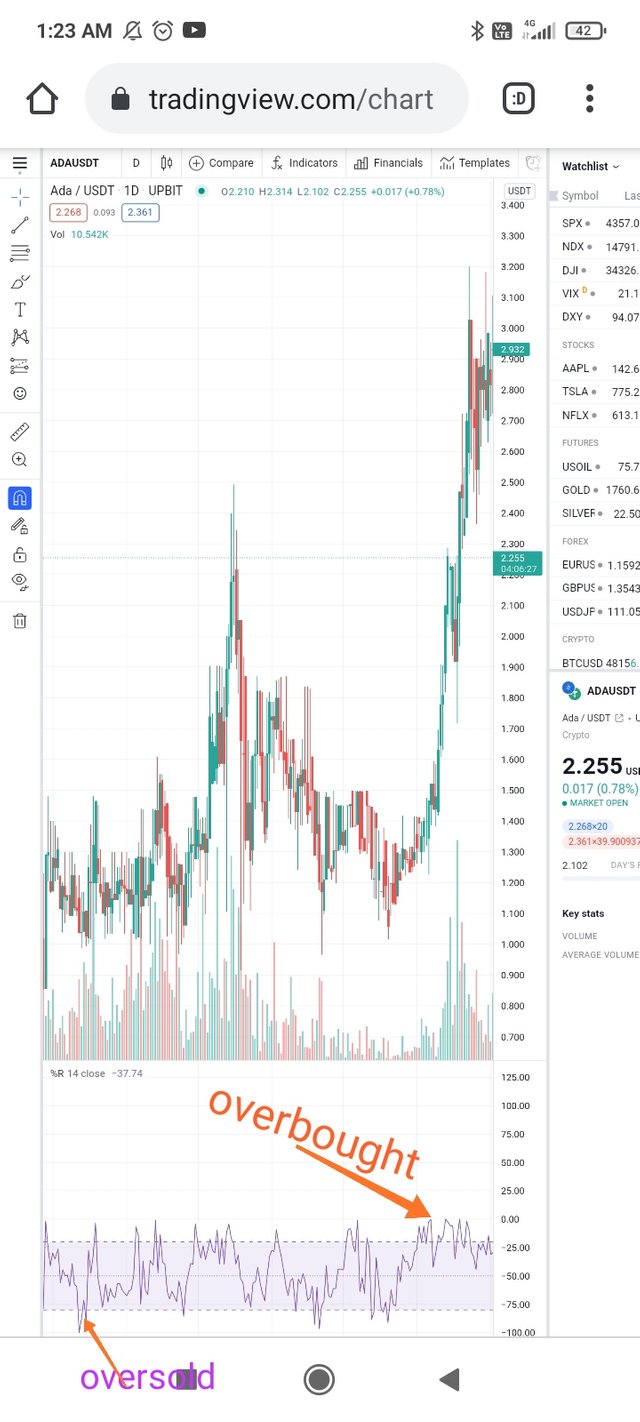
Above i tell you that the value of Williams %R indicator moves between zero to minus hundred and the middle value is -50. There are two important levels in this one is 0 to -20 and -80 to -100 when the indicator is between the value of 0 to -20 the price is overbought or it is near or close to the price of recent high. As we know when the price of any coin reach its overbought then price will start falling back as people will sell their assets this gives us signal of selling our assets.
If the indicator is between -80 to -100 the price of that asset is oversold or it is far from its high. At oversold condition people start investing money again in this asset and price goes up after that . this gives us buy signal.
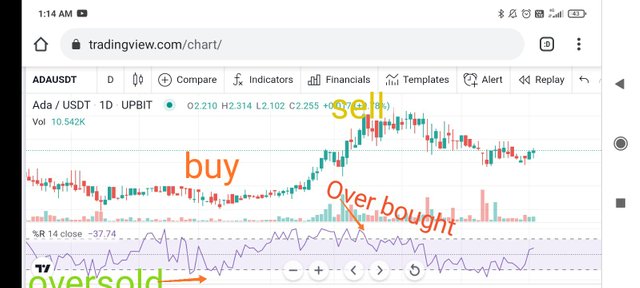
See above the chart of cardano when indicator moves below -80 its oversold and then price moves up so its buy signal there as written on it. When chart moves above -20 its overbought and then price falls so its sell signal as written above.
What are "failure swings" and how do you define it using The Williams %R? (screenshot required)
Failure swings can be called as momentum failure. This means that the Williams %R indicator didn't move in a desired direction or when the Williams %R indicator fails to back into overbought or oversold territory signals. This is caused due to weakness of the trend that does not allow it to cross the boundary and bounces back. In simple language when the price of asset is moving high while the Williams %R indicator didn't cross the -20 and bounces back or when the price of asset is going down but the Williams %R indicator didn't cross the below -80 line and goes back above it these conditions are called swing failures.in other words when price moves up and the Williams %R indicator didn't cross -20 line and pushes it back price will start going down and is sell signal there while when the price is going down and it didn't cross -80 line and goes up its price will go up and is a buy signal.
You can see from the above screen shot arrows showing failure signals when it is not able to cross below -80 line is its price moves up and is buy signal while when it not able to cross upper -20 it is sell signal.
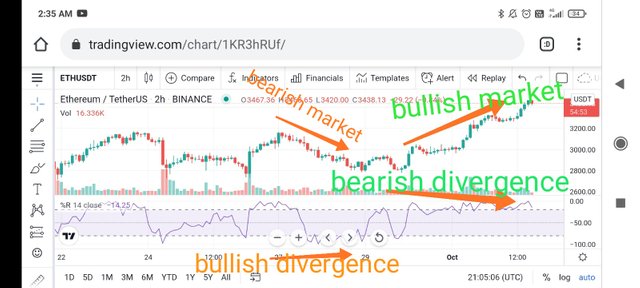
How to use bearish and bullish divergence with the Williams %R indicator? What are its main conclusions? (screenshot required)
Bullish divergence occurs when the price of any asset moves in upwards and makes higherhigh ,while Williams %R indicator lower low. It means they both are in reverse. On the other bearish divergence occurs when the price of any coin moves in downtrend and makes lower low and our Williams %R indicator indicates higher high.These divergences gave us power full signals that can lead market in opposite direction. The bullish divergence gives us buying signal while the bearish divergence gives us sell signal.
How do you spot a trend using Williams %R? How are false signals filtered? (screenshot required)
We know what Williams %R indicator gives information about where the current price compare it with higher high and lower low of 14 periods which chosen by trader. When the indicator crosses above -20 line it is called overbought from now price will move back. While when the indicator crosses below -80 it is called oversold now its price will go up and is buy signal. When the indicator moves above middle line -50 its bullish trend that means market has potential to go up while when it moves down to it , it is bearish trend and market will go down.
As we all know in this world nothing is 100% perfect same no indicator will give you 100% result there are chances of falls signals by indicator which may lead a huge loss to trader. So always see few more in combination to Williams %R indicator and use this.then it will give better results.
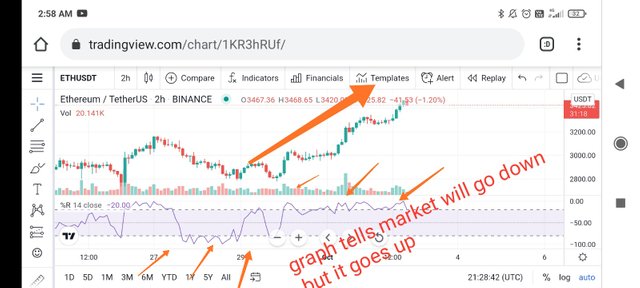
The above screen shot shows lot of wrong signals regarding Ethereum . it takes market will go down it goes up and vice versa. So its better to use combination of indiactors.
Use the chart of any pair (eg STEEM/USDT) to present the various signals from the Williams %R indicator. (Screen capture required)
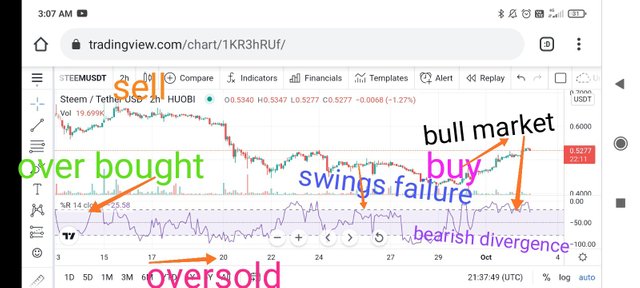
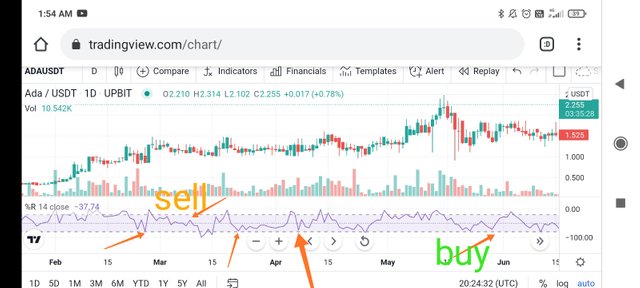
Various signals that Williams %R indicator gave overbought , oversold, divergences and buy and sell signals. You can see from the above image when the the indicator crosses below -80 line it is oversold and then its price will move up and is buy signal also when indicator moves above -20 line it is overbought now its price will move down and is sell signals.swing failure during bullish gives sell signal and during bearish gives buy signal.
Conclusion:
THANKS FOR READING.
Hello @alexcarlos,
Thank you for participating in the 4th Week Crypto Course in its 4th season and for your efforts to complete the suggested tasks, you deserve a Total|6/10 rating, according to the following scale:
My review :
An article with an acceptable content, where all the answers were not deep in the analysis, despite the fact that they contained useful information, but the interpretation and explanation required opening several dimensions of the question according to a clear methodology.
Thanks again for your effort, and we look forward to reading your next work.
Sincerely,@kouba01
This is very educative... Thanks for sharing.