Trading with Volume Indicator - Crypto Academy / S4W2 - Homework Post for @kouba01
1. Explain the volume indicator in your own words.
The volume indicator is the most basic one to use in any market because it measures the quantity of assets' exchange in a specific period of time, such as one day, four hours or even 15 minutes. It is usually presented in form of vertical columns that are located below the chart (corresponding every candle) with two colors: in green when price closes upper than the previous candlestick or red when price closes lower than the previous candlestick.
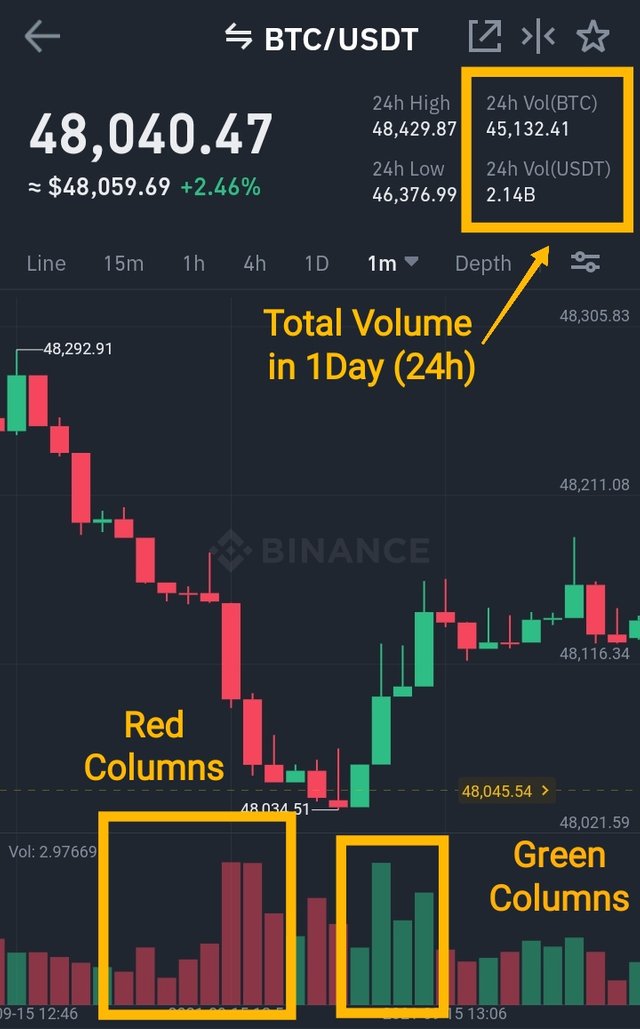
As we'll be looking in the following paragraphs, we will be noticing a greater columns for those candles where there was an intense trading activity, meanwhile you can find less interest in the asset with minor volumes. Let's see.
2. Use a platform other than Tradingview to present the volume indicator on a chart and show how to configure its parameters by justifying your choices.
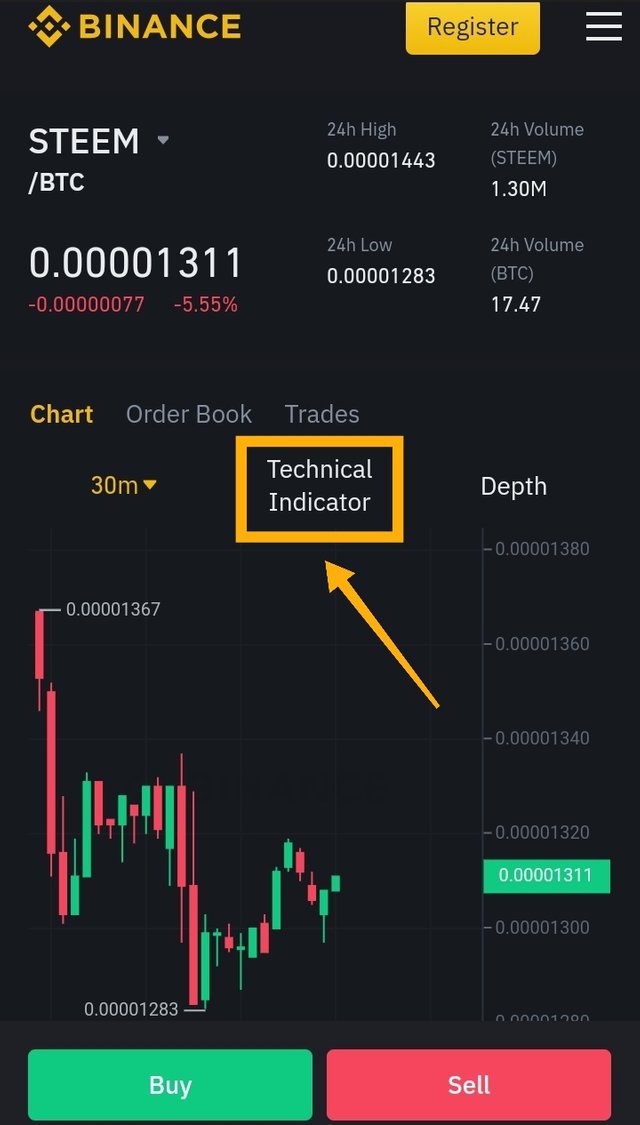
Through the use of this indicator in Binance exchange, we can follow the next steps to configure it over there:
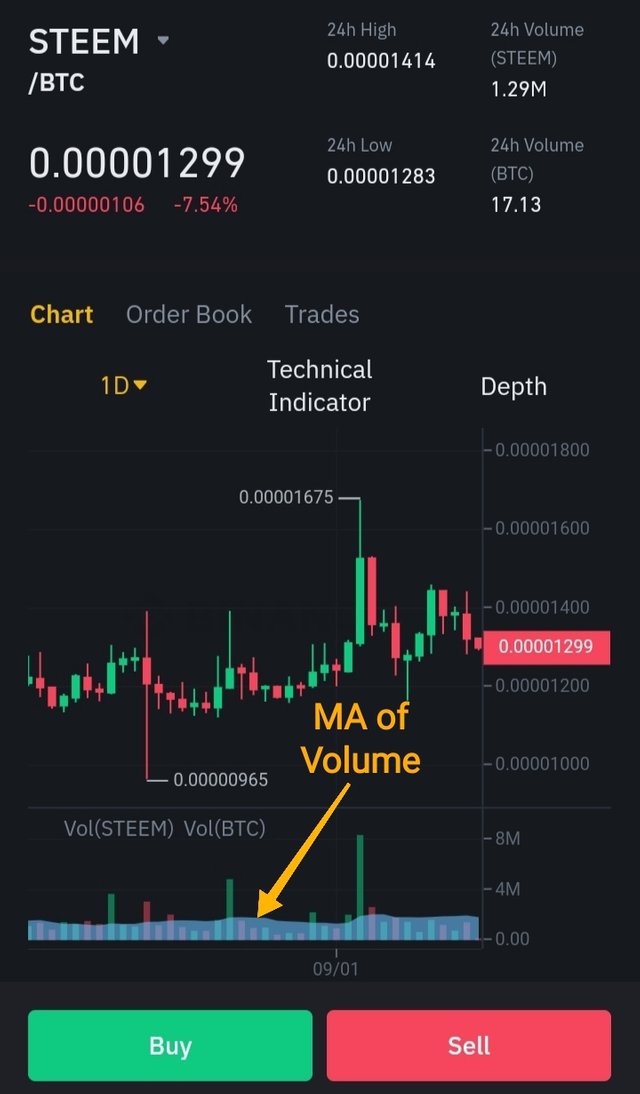
~Located at the trading area, let's choose the technical indicator button that is highlighted in the screenshot below.
Once we reached the displayed window, we'll make click over volume option to set the number of previous candlesticks average, moreover of the desired color.
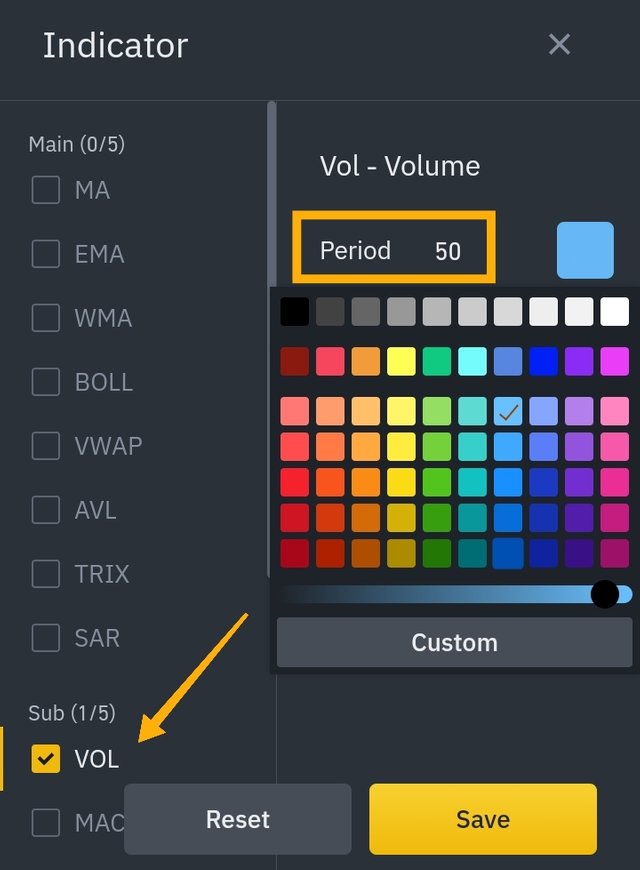
~As I've stated in the last picture, I choose 50 for the moving average of volume in blue on the chart because the higher number the more accuracy of the indicator we're obtaining from it.
3. What is the link between volume and trend and how to use volume to predict a trend reversal?
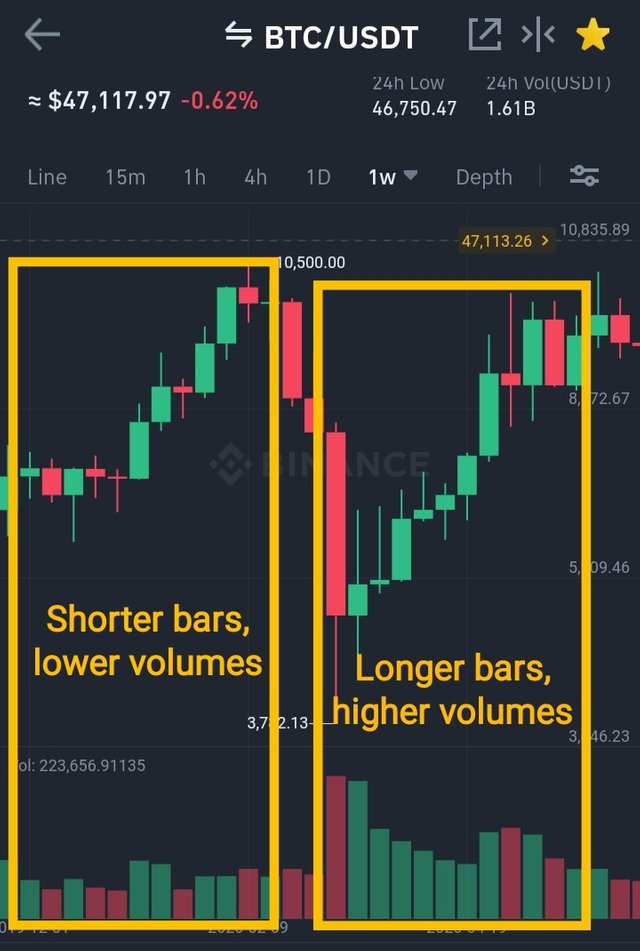
As we already know, we can notice by often an evident increasing of bars when price rises/falls significantly making possible the completion of most orders:
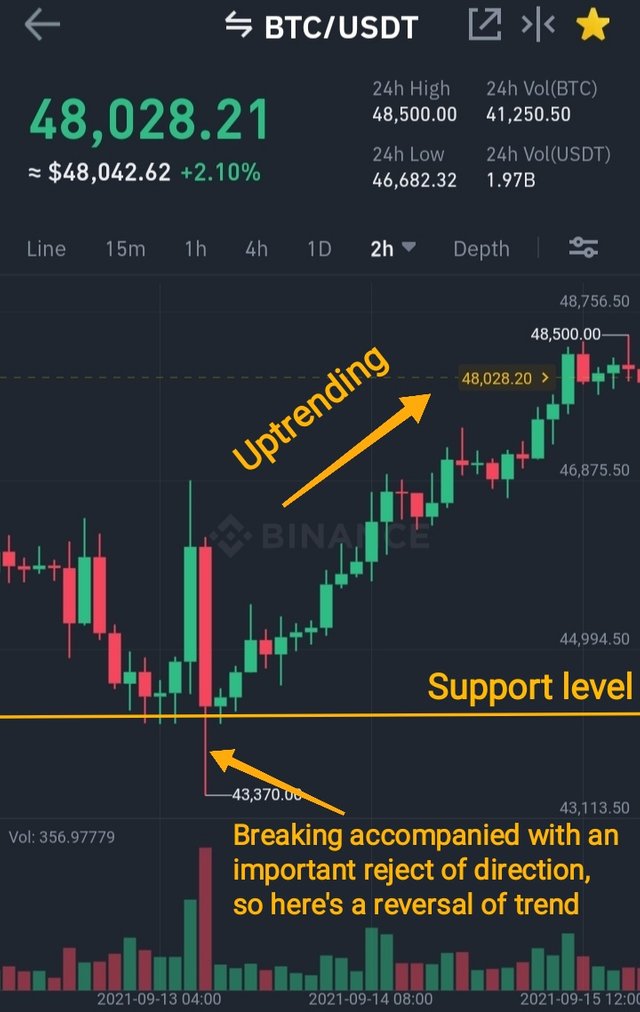
📈In an uptrending case: When bars are longer accompanied with the increasing of price, the volume columns are usually even bigger and shorter if the value is decreasing a bit during correction (testing).
📉In a downtrending case: When bars are longer accompanied with the decreasing of price, the volume columns are usually even bigger and shorter if the value is increasing a bit during correction (testing).
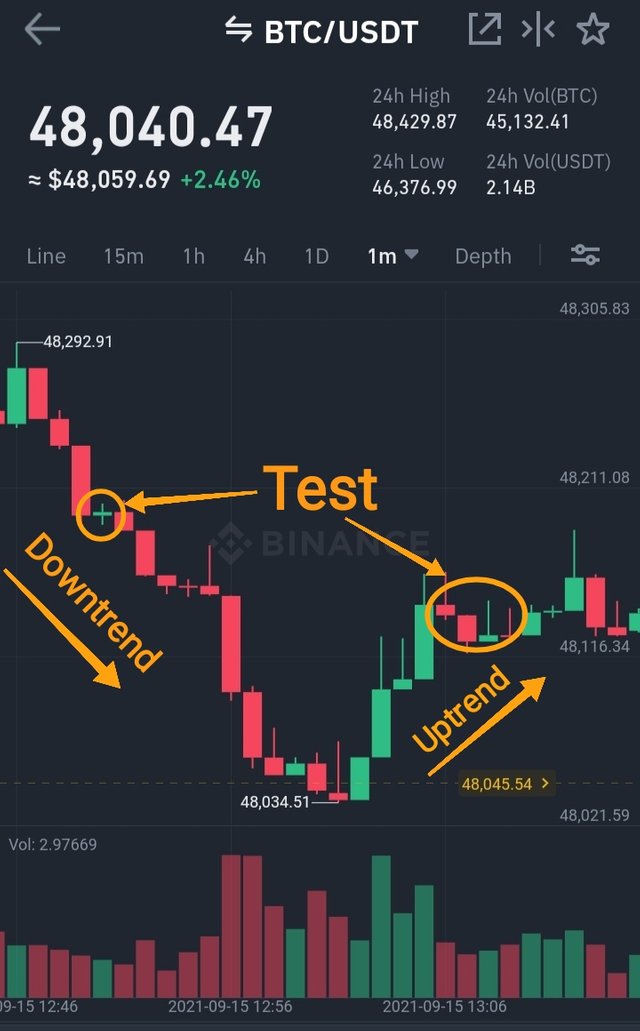
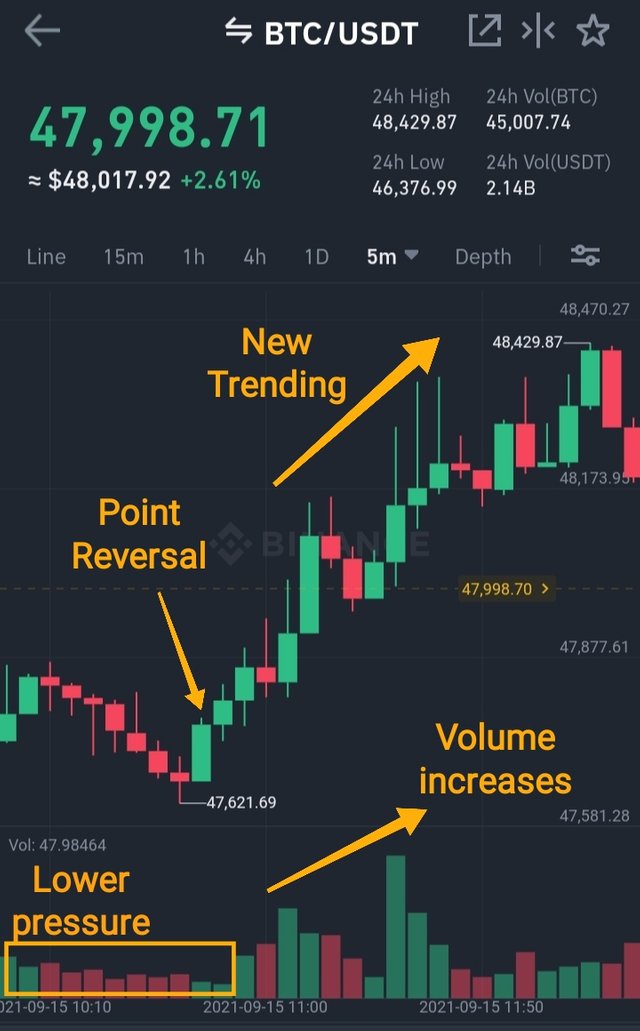
The diminution of price's pressure with an evident reversal might be predicted thanks to the diminution of volume columns, bringing an incrementation of them as consequence of a new trend in market.
4. How to use the volume to have a signal confirmation?
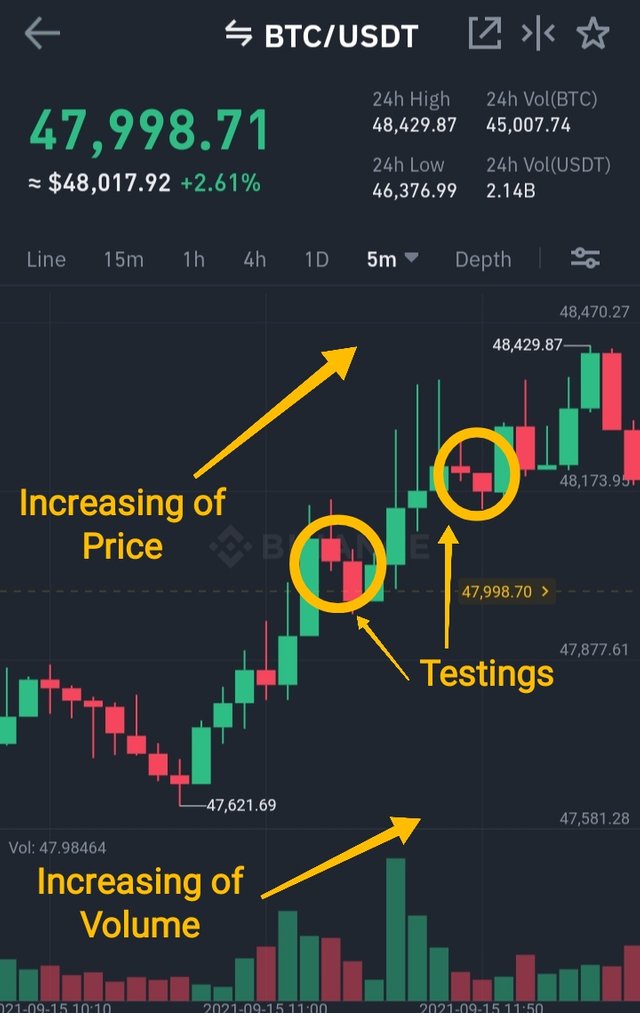
It's necessary to see carefully the increasing of columns on the current trend situation with small contrary movements of consolidations (tests) that will help to confirm the real trending and avoid fake signals. So, after these tests, of course it's normal to see the continuation of price direction and then seize the opportunities to obtain benefits by trading with volumes.
Is not uncommon to expect a continuation of trending during an important breakout of support/resistance levels due to the completion of most orders, bringing a lack of buyers/sellers as consequence if volumes are weaker after the mentioned breaking, depending of the case for a possible reversal.
5. How does the volume reflect the evolution of prices in the charts and why does the volume sometimes anticipate the price?
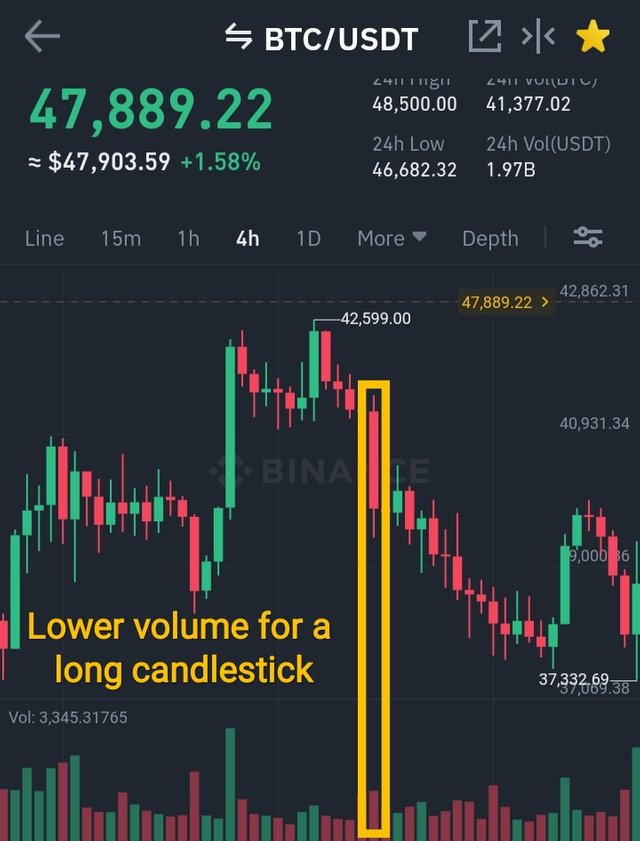
Once again I emphasize the retesting movements in price that are usually linked to the continuation of trending on the chart of interest, so volumes should be following the direction with an evident increasing of columns. It could be possible the presence of weaker volume bars that are usually untrusting if they're accompanied by longer candlesticks, so we must be careful during the analysis of them.
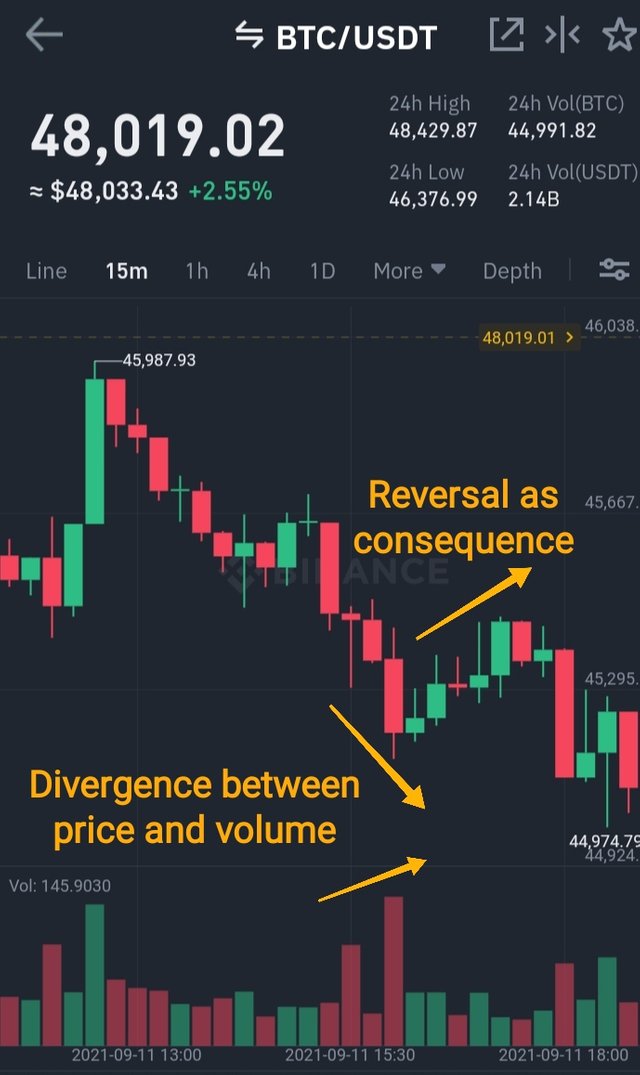
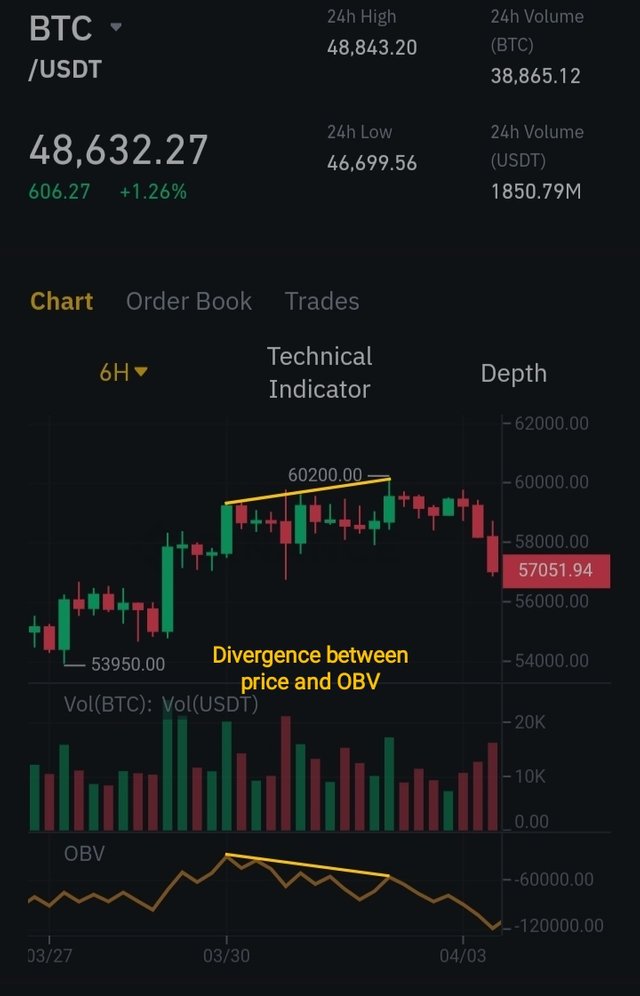
Through the drawing of a divergence between price and volume, we can reach the prediction of value after seeing one of these situations:
| Feature | Uptrend | Downtrend |
|---|---|---|
| Price | Higher High Peaks | Lower Low Peaks |
| Volume | Lower Low Peaks | Higher High Peaks |
Here we can also anticipate a future reversal for the most of divergent cases because of these unmatched direction of lines between price and volume, so you can use this as one of our methods for trading crypto or other assets.
6. Is it better to use the volume indicator alone or use it in parallel with another indicator when trading?
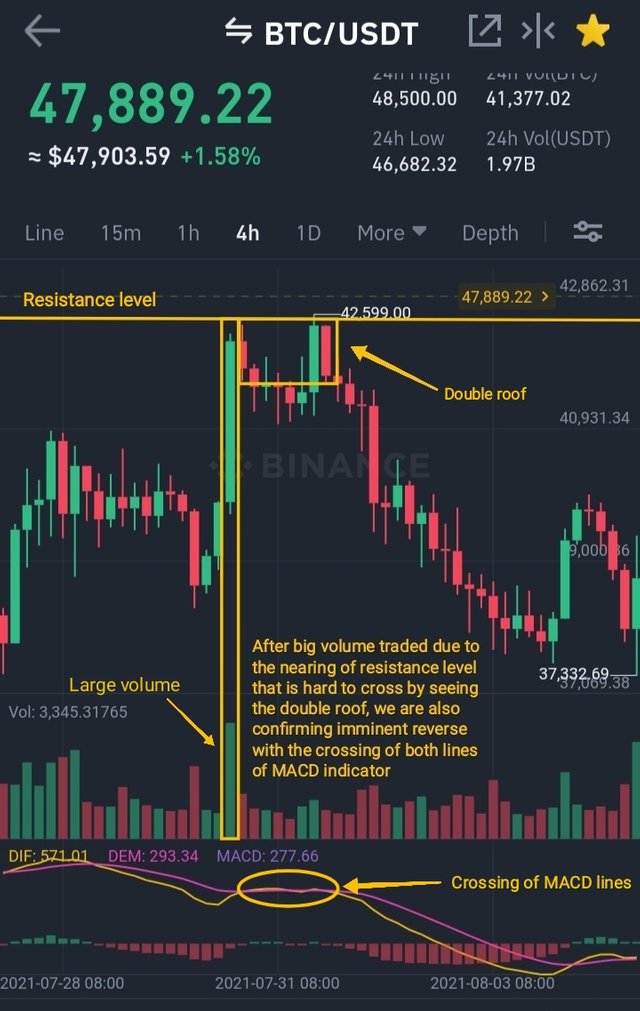
As volume feature is basically an amount that were traded in certain time frame, this is not enough to only use it in our strategies to get benefits from markets. It's essential the help from another one if we want to have success with lower losses of capital. I personally prefer to use also the MACD indicator because it has already incorporated the volume feature, where I can obtain an extra confirmation of trending with the crossing of its two lines that will tell me how would be the current trending of market.
7. The volume indicators are multiple, choose one of them to briefly explain its usefulness in crypto trading.
In this opportunity I'm choosing the On-Balance-Volume Indicator (OBV), one of the most popular ones that are currently used by many traders as they can check the graphic line to get a possible divergence for instance and seize the opportunity of a market's reversal. Consists in the accumulative measure of volume's flow thanks to the price's impulse and there's no need of this one to change first before indicator does that. So it's an excellent tool to predict how's the real balance between sellers and buyers in the market, working better with stables changes over values.
The main disadvantage is the presence of price's manipulation that is common nowadays and it's very easy to being catch by fake signals in this indicator, so beginners need a lot of practice to figure out when we're in front of movements made by institutions or retailers that will be making an influence over the dimension of volatility.
8. Conclusion
Is not enough the volume itself to take decision for trading because suddenly spikes as a consequence of greater news that might be disturbing markets with no logical reason. So, it's a good advice to utilize an extra indicator and pay attention for the divergences, breaking of resistance/support levels, etc. Anything else is valid, so for sure the volumes are a very simple but powerful tool to consider in your trading strategies and have a profitable performance of your finances.
👷🏻♀️>>~•Alegn@•~>🎶
*** See you in next post *** 📝
Hello @alegnita,
Thank you for participating in the 2nd Week Crypto Course in its 4th season and for your efforts to complete the suggested tasks, you deserve a Total|3.5/10 rating, according to the following scale:
My review :
An article with under-average content, where you built most of your answers on graphs without analyzing them in depth or following a clear methodology to explain their content, and therefore the article misses the editorial and critical dimension.
Thanks again for your effort, and we look forward to reading your next work.
Sincerely,@kouba01
Hi professor @Kouba01. Honestly, I've found this task a little hard to me during the development of every question. But I did not give up despite of everything. Because I'm really interested to learn and improve my trading skills to have a good performance in that area. Thanks for the provided observations. #venezuela #affable
Very Nice HomeWork. It's great that you are following Crypto Academy My Friend. Good luck in following.
Thank you @Tucsond. I must make an extra effort for the following weeks. In this opportunity, task has resulted a bit difficult to me, moreover of less available time to do it. 😅 But most important is to try to learn and grab such great knowledge for the future. Regards to you. #venezuela #affable