YFI - options for further price movements
Hello! I have been trading in the futures and spot markets since the end of 2017. Today I want to share my thoughts with you on the further movement of the price of YFI.
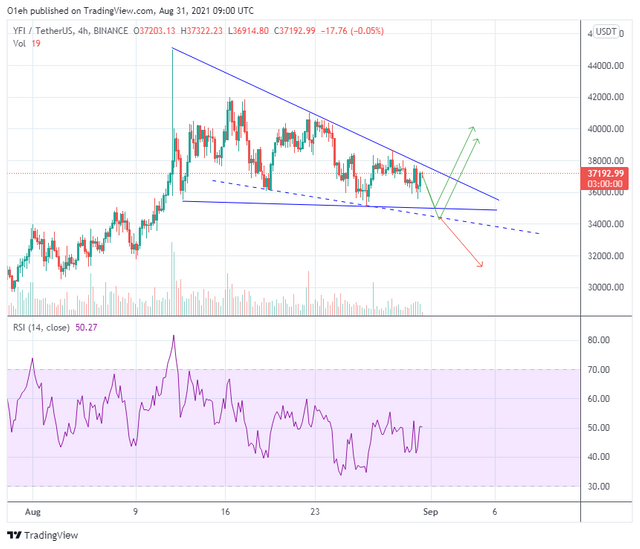
On the chart it is easy to notice that the price of a drawing figure is a descending wedge. This is a bullish figure, ie it is more likely that the price will go up.
The upward movement in this case can occur in two ways:
- starting from the support line in the area of $ 35,500;
- starting from the support line in the area of 34450 dollars.
The third option is to continue the fall in prices. It also cannot be neglected. However, I prefer the bullish scenario.
Successful trade to you.