An explanation of Bollinger Bands and how to identify overbought and oversold situations
While certain indicators are truly useful for trading, many others have not been shown to be reliable or helpful. These signs can help you about 50% of the time.
source
The most well-known and functional indicators are the Bollinger Band, EMA, MACD, and RSI. These are the most often utilized indicators, despite their seemingly straightforward appearance.
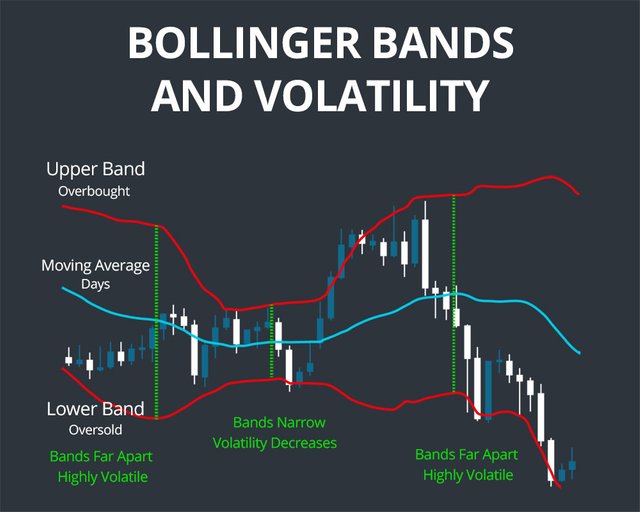
Among these indicators, today I will discuss on BB (Bollinger Band). One of my favorite indicators for understanding risk and market volatility is this one, which tells you whether a position is overbought or oversold.It's quite easy; all you need to do is include this indication on the chart. The three lines or three bands will then appear.
three bands: the top, middle, and bottom. When the top band shows that the market is overbought, you can sell your holdings or begin short positions as soon as the coin hits that level.
Similarly, when the price hits the lower band, it is an oversold situation with a higher likelihood of a price rebound. You can open long positions or buy at this point.These bands can occasionally widen, which indicates a volatile market. It is recommended to wait until the bands narrow and avoid opening any trades under such circumstances.
Additionally, when the price is in the middle band, it is unpredictable and you can use additional indicators to help you continue trading.