Mastering Chart Pattern Analysis for Successful Trading

Introduction:
Many people believe that trading success depends on natural instincts or innate abilities. However, the truth is that profitability in trading primarily stems from the skill of analyzing market conditions. One essential aspect of analysis is the ability to read and interpret chart patterns. In the world of cryptocurrency trading, two commonly used chart types are line charts and Japanese candlestick charts. In this blog post, we will explore these chart patterns, their practical information, and how they can assist in making informed trading decisions.
I. Line Charts vs. Japanese Candlestick Charts:
1. Line Charts for Medium-Term Trading:
- Line charts are suitable for medium-term trading strategies where minimum and maximum indicators are not the primary focus.
- Traders can effectively use line charts to analyze trends and general market movements.
2. Japanese Candlestick Charts for Decision-Making:
- Japanese candlestick charts are widely preferred due to their simplicity and clarity.
- These charts provide valuable information for making trading decisions, allowing traders to visualize the overall market situation and forecast price movements.
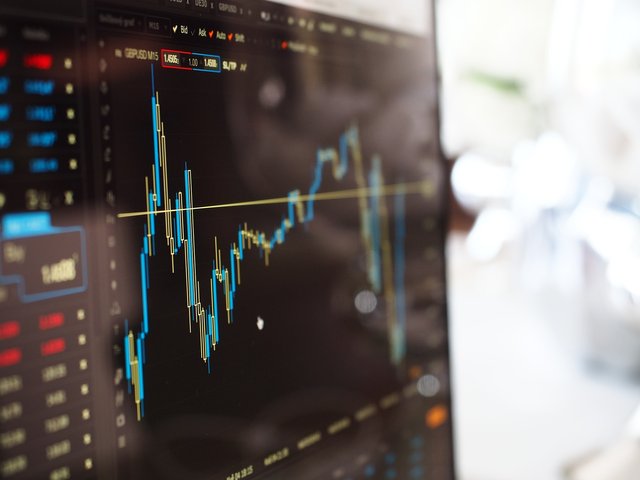
- Candlesticks incorporate indicators of opening and closing trades, as well as the highest and lowest prices during a specified time frame.
II. Understanding Japanese Candlestick Charts:
1. Components of Candlesticks:
- Candlesticks consist of a rectangular body (black or white) and upper and lower shadows (wick).
- The body represents the opening and closing prices, while the wick indicates the highest and lowest traded prices within the specified time interval.
2. Time Frames in Candlestick Charts:
- Each candlestick chart has a defined time frame, typically ranging from one hour to one day or one week.
- Analyzing candlestick charts across different time frames helps traders gain a comprehensive view of price trends and historical highs and lows.
III. Choosing the Right Time Frames for Analysis:
1. Importance of Historical Price Data:
- Given the relative youth of the cryptocurrency market, analyzing previous minimum and maximum prices can provide valuable insights.
- Consider analyzing weekly and monthly charts alongside daily time frames to gain a comprehensive understanding of market trends.
2. Paying Attention to Technical Analysis:
- Technical analysis tools can assist in identifying patterns and market sentiment.
- Moving averages, such as the 50-day and 200-day moving averages, help traders gauge average price levels and market trends.
- Volume, an important indicator, reveals the number of transactions within a specific period and can help determine market liquidity and participant interest.
IV. Interpreting Chart Patterns and Volume:
1. Volume as a Key Indicator:
- Volume plays a crucial role in confirming price movements and market trends.
- Significant price movements accompanied by increasing volume indicate strong market participation and potential profit opportunities.
- Conversely, declining prices with rising volume may signal a bearish trend and suggest caution.
2. Identifying Breakouts and Reversals:
- Chart patterns, combined with volume analysis, can assist in identifying breakout points and potential reversals.
- Breakouts occur when prices move beyond established ranges, while reversals indicate a change in market direction.
- Volume spikes during these events provide confirmation and can act as entry or exit signals.
V. Platforms for Chart Analysis:
1. Exchange Similarities and Chart Correlation:
- Cryptocurrency exchanges like Poloniex, Kraken, and Bitfinex offer similar charting tools and price data.
- While minor differences may exist, the charts on these platforms are typically correlated and provide similar information for analysis.
VI. Timing Your Trades:
1. Entry Points Based on Volume:
- Enter trades when there is a range-bound market followed by a volume spike.
- Buy when the price breaks out of the range and sell when the price retraces back into the range.
2. New Highs and Lows:
- Another opportune time to enter trades is when a cryptocurrency reaches a new high or low.
- Volume confirmation during these price extremes can validate the strength of the trend and present potential trading opportunities.
Conclusion:
Mastering chart pattern analysis is a fundamental skill for successful cryptocurrency trading. By understanding the nuances of line charts and Japanese candlestick charts, traders can make informed decisions based on market trends and price movements. Analyzing different time frames, paying attention to technical indicators like moving averages and volume, and identifying breakout points and reversals can significantly enhance trading strategies. Utilizing reliable charting platforms and timing trades based on volume spikes and new highs or lows can further improve trading outcomes. Remember, consistent practice and continuous learning are key to refining your chart analysis skills and achieving success in the dynamic world of cryptocurrency trading.