Technical indicators II - Crypto Academy / S4W4- Homework Post for @reminiscence01

Hello everyone, would love to join Prof. @reminiscence01 to welcome you all to week 4 of this Academy season. You could also make your assignment entry after checking out this link. Here are my answers below:

1. a) Explain Leading and Lagging indicators in detail. Also, give examples of each of them.
In trading today, there are tools that help the trader to make wise decision and acquire a whole lot of profit. An example is the leading indicator, leading indicators are tools or instruments initiated on the trading charts to help the trader predict the future price movements of assets before the market goes into an uptrend or a downtrend. They are Indicators that point the direction where prices in the market are about to go. This indicator through series of calculations with current prices forsees the next possible trend and generates a pattern or signal for the trader. An example is the pivot point, Fibonacci retracement etc.
Although there isn't a confirmation of the next trend with the leading indicator (since the signal is given before the next trend starts, there isn't a proof of a downtrend or uptrend on the price chart), it helps investors or traders to go into trades early before the next trend starts. That means, if it indicates a price overbought signal, the trader will be hinted to make a sell trade and if it indicates a price oversold signal, the trader will make a buy trade. I must say, as much a the leading indicators may feel like you have just realised a gold mine, in some cases, it may not be correct. For example:
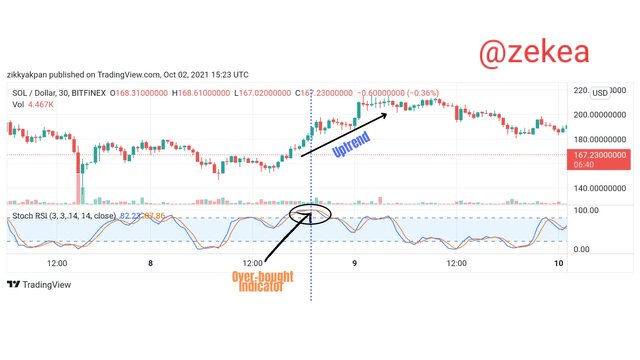
In this chart, the leading indicator gave a wrong signal and this may have put a whole lot of traders in a muddy situation. Lots of losses for the day.
Lagging Indicators are instruments used to identifies the beginning of a trends after it has always started. As the name implies, this indicator is slower than the leading indicator. It indicates a trend once it has experienced a crossing with one of the bullish or bearish candles. This indicator gives confirmation of the current price trend for traders.
It is somewhat a trustworthy tool and prevents a few losses in case of divergence but it's nature is slow and causes the traders to enter trades late when the trend has already started. Sometimes the traders miss judge the market because of this tool and miss out on good trades Examples of this indicator is the SMA (simple moving average) and KAMA (Kaufman adaptive moving average).
1. B) With relevant screenshots from your chart, give a technical explanation of the market reaction on any of the examples given in question 1a.
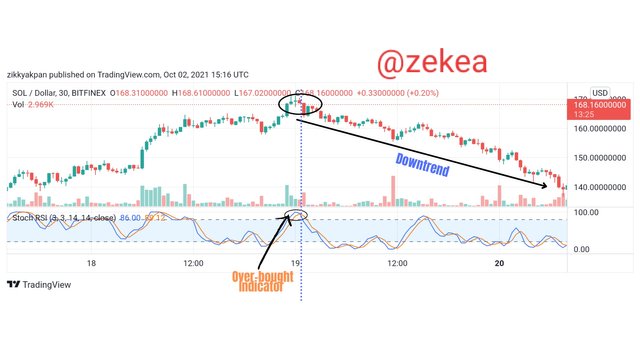
For the leading indicator,
From the screenshot image above, the over-bought signal indicates that there is going to be a downtrend, meaning that sellers are going to take over the market. I drew the vertical doted line to emphasize that the signal was produced before the downtrend began.
In this image the indicator was correct and traders who follow it up must have made profits from the market.
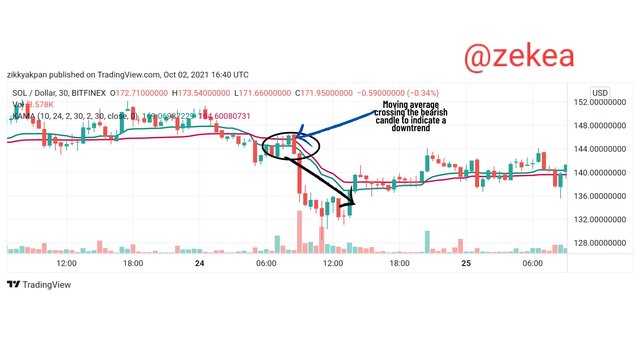
For the lagging Indicators,
From the image above, the moving average was in a horizontal structure. After some time, it crossed the bearish candle and began to slope down. Hereby confirming the downtrend in the market.
2. A) What are the factors to consider when using an indicator?
This matters a lot, some newbies without the knowledge of all these run into these indicators and tend to make a lot of losses. Here are some factors needed to guide traders in using technical indicators:
The nature of the indicator:
Before you use any indicator, you have to go into research to learn every single feature that qualifies that indicator. Studying the various types of indicators and understanding the meaning of every single signal it displays. Learning the indicators pros and cons, how slow this particular one reacts and how fast the other is. Just like the leading and lagging. This would give the traders confidence in making their trades and helps them avoid losses.What trading strategy do you make use of:
Everyone has a particular method they use in making trades. They have a specific way of analysing the market prices. There are long term traders and traders who just make trades for daily profits. You need to find out what you're in for. Once you understand your pattern, the next thing is to evaluate the indicators based on their characteristics, select a few and recalibrate them to suites your style.Matching confluences:
When trading, it's not a bad idea to mix things up and use a few other indicators to confirm the future movement in prices. If all of them are signaling the beginning of a trend, it gives the trader the confidence and a little bit of assurance before making his decisions.
2. b) Explain confluence in cryptocurrency trading. Pick a cryptocurrency pair of your choice and analyze the crypto pair using a confluence of any technical indicator and other technical analysis tools.
The use of the confluence strategy is very useful in trading because it helps the trader confirm the trades and gives him affirmation on his choices. Confluence in trading is simply a condition where two or more indicators give out the same information or signal to the trader. In a case where the stochastic and the moving averages affirm the fact that the price is going into a downtrend, this is known as a confluence of signals. An example is shown in the image below:
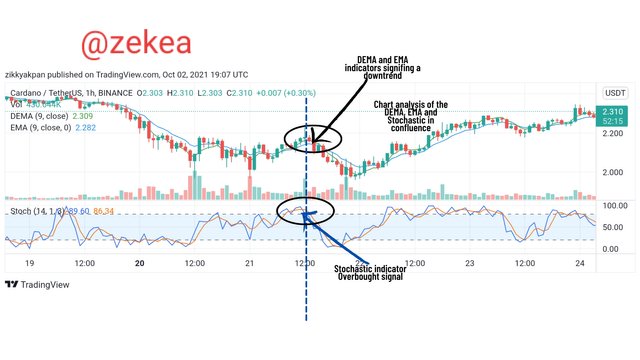
This is a representation of the DEMA, EMA and stochastic indicators all in confluence to signify the beginning of a downtrend.
3. a) Explain how you can filter false signals from an indicator.
This is simple, but first we must understand what a false signal is. A false signal is a condition where an indicator is signifying or giving out a wrong information. What I mean by that is the indicator displaying an over-bought signal and then the market is still in an uptrend. An example is shown below
This is very bad for business and we need to figure out a proper solution for this. In my view, the best solution is to use more than one indicator (as explained in question 2b). Probably two or three, then check to be sure that sure that all of them are in confluence before making trading decisions.
3. b) Explain your understanding of divergences and how they can help in making a good trading decision.
The divergence is a situation where the prices of digital assets are flowing in an opposite direction to the indicators. For instance, the market prices are moving in an uptrend while the indicators are still moving down. In a scenario like this we the analyst should expect the market price to take a reverse and start a new trend overtime.
This is a very fascinating tool which guides the traders and prevents them from experiencing a panic to make wrong decisions. Although, some traders see the divergence as a fault from the indicators it can be of good use in trading.
3. c) Using relevant screenshots and an indicator of your choice, explain bullish and bearish divergences on any cryptocurrency pair.
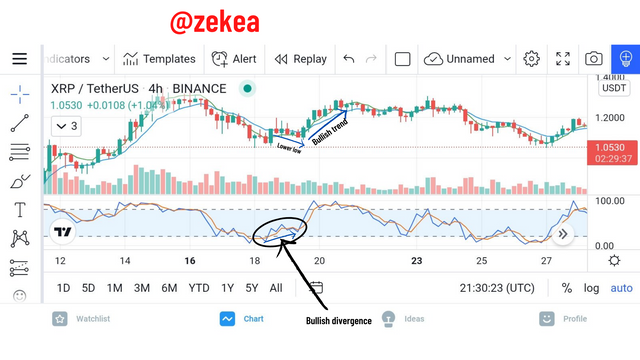
A bullish divergence is a scenario where the indicator displays a lower-high while the market price displays a lower low which means a downtrend. Overtime the market reverses and goes into an uptrend. Here is an example below
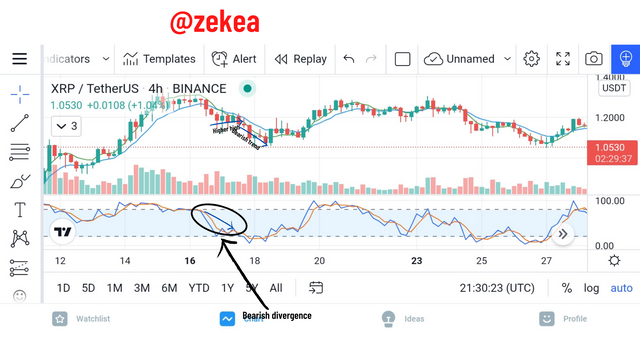
For a bearish divergence, it is a scenario where the indicator displays a lower low while the market price displays a higher high(an uptrend). Overtime the market reverses and goes into a downtrend. Example
Technical indicators like the lagging and leading indicators are very useful tools in trading this age. The leading indicator signifies that the market is about to go into a trend while the lagging indicator confirms the current trend.
Combination of this tools would aid traders to make good trading decisions and acquire loads of profit in the process. Although, it is important to know that trading is a very risky game and there isn't any guarantee of not making a loss.
Aside all that, I really learnt a lot today. Thank you Prof. @reminiscence01 for the lesson
Hello @zekea , I’m glad you participated in the 4th week Season 4 of the Beginner’s class at the Steemit Crypto Academy. Your grades in this task are as follows:
Observations:
This chart is incorrect for bullish divergence. The price action didn't create a bearish structure which is a lower low formation.
Recommendation / Feedback:
Thank you for participating in this homework task.
Thank you Prof. @reminiscence01