Advanced Breakout Strategies with Volume Profile and VWAP".
|
|---|
Hope you all are doing well and good and enjoying the best days of your life. This is me @shahid2030 from Pakistan and you are here reading my post. You all are welcome here from the core of my heart.
This is my participation in a contest Advanced Breakout Strategies with Volume Profile and VWAP organized in SteemitCryptoAcademy by @crypto-academy.
Question 1: Explain the Concepts of Volume Profile and VWAP. Define Volume Profile and VWAP and discuss how each tool provides unique insights into market dynamics. Explain their role in identifying potential breakouts. |
|---|
Volume Profile:
Volume Profile we call it a technical analysis tool that provides us a detailed breakdown of trading activity over a specific time period at different price levels. It's quite contrast to traditional volume indicators, which show volume over time. Volume Profile merely focuses on volume by price. Let's have a look how it works:
- Structure: It gives us display of a histogram on the vertical axis (price levels), which shows us the volume traded at each price level.
Key Components
Let me explain there important levels.
- Point of Control (POC): It is the price level with the highest traded volume during a specified time period.
- Value Area (VA): The range of price levels where a significant percentage of the total volume occurred. Most commonly we take 70% for it.
- High Volume Nodes (HVNs) and Low Volume Nodes (LVNs): A respective Price levels where high or low volumes were traded.
Purpose:
- It's major aim is to Identifies areas of support and resistance.
- It also helps traders to point out where most of the market activity is concentrated. It facilitates traders to indicating potential areas of future price movement or consolidation.
VWAP (Volume-Weighted Average Price):
VWAP stands for Volume-Weighted Average Price. It generally represents the average price of our security over a specific time period, weighted by trading volume. It's calculated as:
VWAP = \frac{\sum (Price \times Volume)}{\sum Volume}
Key Characteristics:
Dynamic Indicator: It keeps us updated throughout the trading session.
Benchmarked Price: It is used by institutional traders for their confirmation. They use it to gauge whether they are buying or selling at a favorable price relative to the day's average.
Purpose:
Trend Identification:
- When the Price is above VWAP, it Indicates bullish sentiment.
- Price below VWAP: Indicates bearish sentiment.
Execution Benchmark: It also helps traders evaluate their trade execution quality by comparing their trade price against the VWAP.
Differences and Uses:
- Volume Profile It provides us a complete insights into volume distribution across price levels over a time range, on the other hand VWAP gives a single average price for a time period.
Volume Profile We mostly use it for the identification of support/resistance zones, while VWAP do helps us in tracking average price performance and trend direction.
Question 2: Identifying Breakout Zones with Volume Profile. Use historical charts of Steem/USDT to show how Volume Profile identifies areas of strong support/resistance and low-volume zones where breakouts are likely to occur. |
|---|
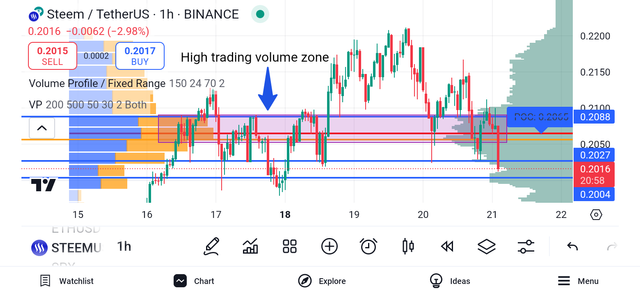
As we already know that volume profile gives us the major volume zones on our chart. Using those zones we can identify the best breakout zones or in short the best support and resistance levels. Let's identify some major breakout zones on Steem/USD chart.
This is the current STEEM/USDT chart on one hour time frame. I have applied two volume profile; one is general and other is fixed range volume profile. Both are giving us the same direction over s special period of time.
A zone under the rectangle is the high volume zone making a strong breakout area for us. It has worked best as a support or resistance many times in the past, because it is respected multiple times. 0.2050 is our perfect and strong breakout zone. Currently it is penetrated by a long red candle but still it's our support zone, because it could be a false breakout. 0.2088 is our current resistance if this breakout turn out false. It is also our high volume traded zone.
0.2027 and 0.2004 are two other high volume trading areas and our strong support in this current market.
Question 3: Validating Breakouts with VWAP. Discuss how VWAP is used to confirm breakout strength by analyzing its interaction with price movements. Provide examples of price-action behavior near VWAP during Steem’s bull run. |
|---|
The Volume Weighted Average Price (VWAP) is a critical and crucial indicator often used to gauge the strength of breakout moves by analyzing how price interacts with the VWAP line. Let me explain how it works and its relevance to confirming breakout strength:
How VWAP Confirms Breakout Strength
Price Above VWAP: When we find the price breaks out above a resistance level and remains above the VWAP, it suggests that buyers are dominating and their are bullish sentiments in the market, with strong volume supporting the move. This suggests legitimate breakout rather than a false one.
Price Below VWAP: Conversely, if the breakout is not supported by sustained price action above the VWAP, it shows a weak buying pressure or significant selling into the breakout. This may lead to a failed breakout in the market.
Retest of VWAP: Multiple times after a breakout, the price may retrace and test the VWAP. If the VWAP acts as support level (i.e., the price bounces off it), this confirms the breakout's strength.
Distance from VWAP: If the price moves significantly away from the VWAP line during a breakout, it might indicates an overextension. Traders should be ready for a pullback toward VWAP before continuing the trend.
Provide examples of price-action behavior near VWAP during Steem’s bull run.
The most important thing is that we use VWAP for day trading or short term trading, so finding the over all behavior of STEEM coin through this bull run is quite impossible. The high time frame we can use here is 10 minutes. 5 minutes is ideal for it, though we can use 3 minutes and even 1 minute timeframe too.
Let's have a look to the current STEEM/USDT chart on 5 minutes time frame.
In this current chart we have many opportunities for buy and sell trade. Whenever we have seen the market crossing the blue middle line in above position the market went up and their is a buying opportunity for us. Same wherever the market has crossed the middle blue line in downtown direction we have see an opportunity for short position.
Let me indicates all buying position first.
chart No 1
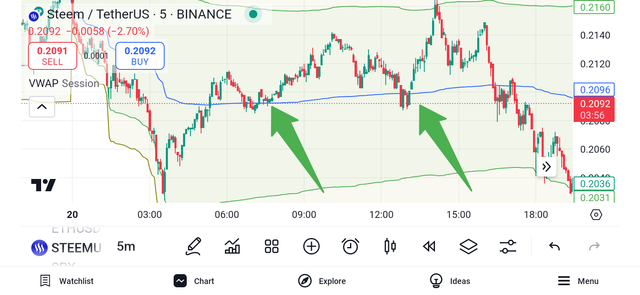
Chart No 2
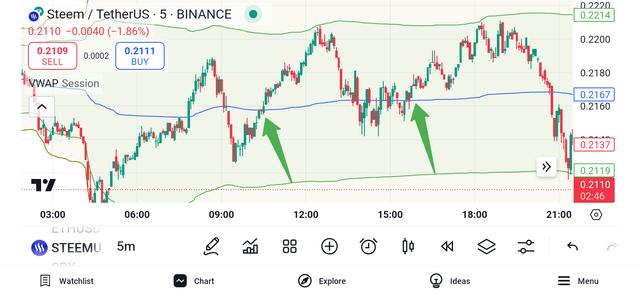
Chart No 3
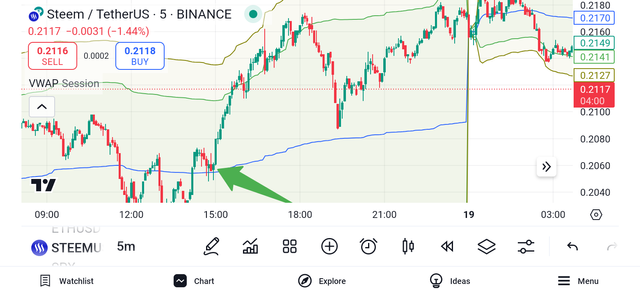
Now let's have a look for buying position.
Chart No 1
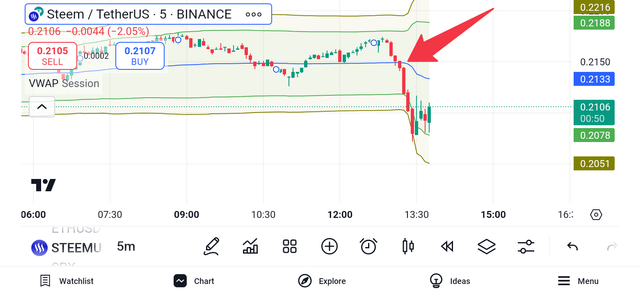
Chart No 2
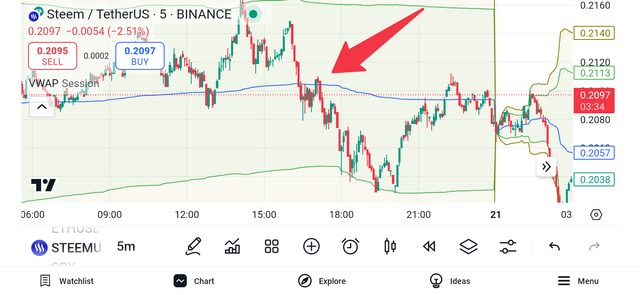
Chart 3
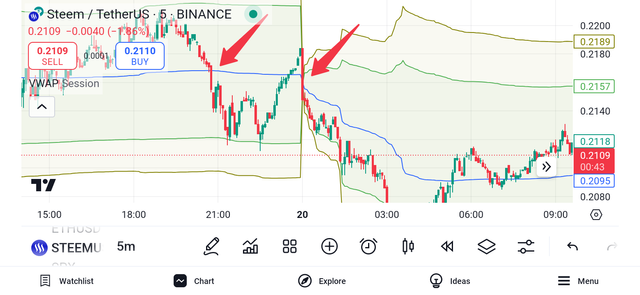
Question 4: Developing a Breakout Strategy. Create a step-by-step breakout trading strategy for the Steem/USDT pair. Integrate Volume Profile and VWAP to define entry points, stop-loss levels, and profit targets. |
|---|
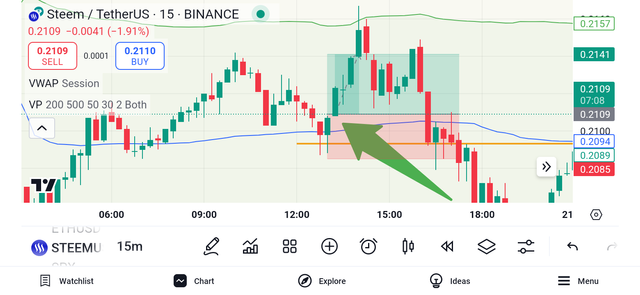
On 15 minutes time frame this is the best buying trade because it is on the major support level according to Volume profile and it has also crossed VWAP blue line in upward direction. A golden long position opportunity it was there. As usual our Stop loss could be the previous lower swing and Profit should be the the previous high swing.
Another chart for long trade
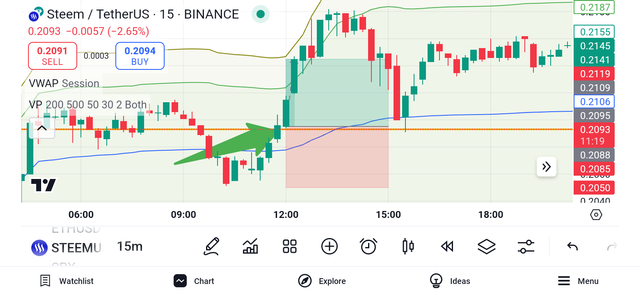
Chart for short position
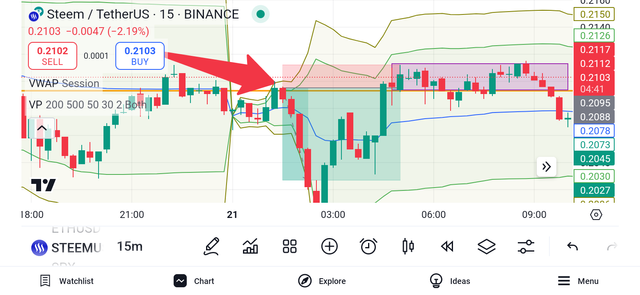
Another trade on that same chart for short position. The price is rejected from volume profile support line and also crossed VWAP blue in downward direction.
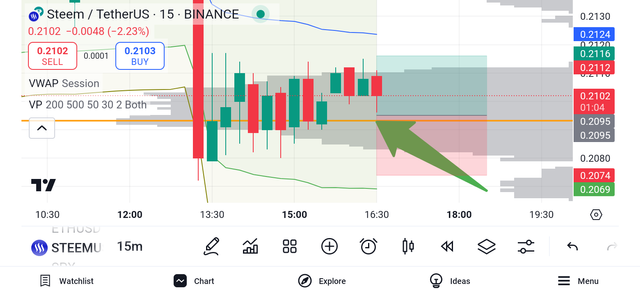
Current situation Market is on it support level and we have seen a retest here too which indicates that market may goes up from here. STEEM's price is already trading above the average line of volume profile.
Question 5: Avoiding False Breakouts, Highlight common risks in breakout trading, such as false breaks, and explain how Volume Profile and VWAP can mitigate these risks. Provide practical tips for enhancing breakout reliability. |
|---|
The best way of identifying false breakout is to wait for the retest. If the market retest the important levels and after retest it continues it's own trend, it's mean the breakout is true.
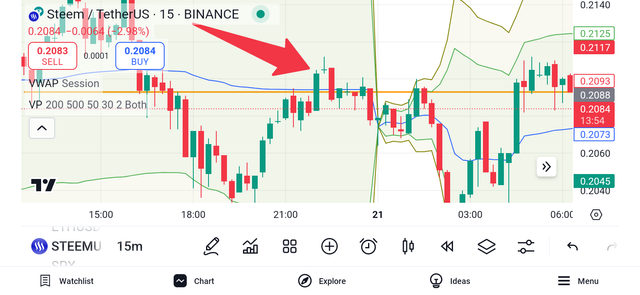
Here in this chart the market has penetrated the resistance in upward direction but still it didn't continue it's trend. It was a fake breakout and we could easily find it if we have waited for the retest. It miserably failed after retest.
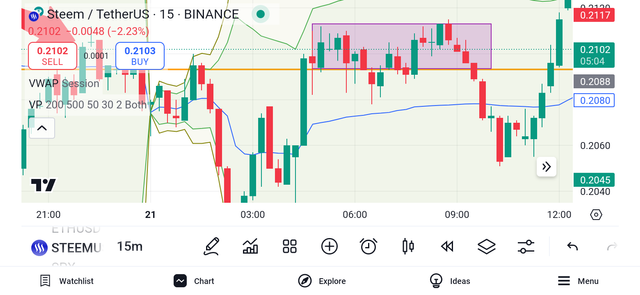
Another fake breakout zone here the retest got failed always.
This is all about my blog for today, hope you guys have enjoyed reading it. See you soon with a new amazing and interesting topic, till take care.

| I would like to invite: @goodybest, @ripon0630, @beemengine, @tommyl33 to participate in this Contest |
|---|
Your presence here means alot
Thanks for being here
Regard shahid2030

