Steemit Crypto Academy Contest / SLC S21W4 : Mastering Breakouts with Volume Profile and VWAP

Hello everyone! I hope you are all doing well and enjoying life with the blessings of Allah Almighty. I am happy to take part in the exciting challenge hosted by SteemitCryptoAcademy community . So, without any further delay, let's dive right in! Shall we ? ........, Okay , Okay😊! .
Question 1: Explain the Concepts of Volume Profile and VWAP |
|---|
Volume Profile and VWAP are powerful tools for traders who want to catch those exciting breakout opportunities with confidence!
Volume Profile gives you a visual snapshot of trading activity at different price levels. Think of it as a heatmap that shows where all the action is happening—where traders are throwing down their bets. High-Volume Nodes (HVNs) are like traffic jams; they're spots where prices linger due to heavy trading, acting as key support or resistance. Meanwhile, Low-Volume Nodes (LVNs) are like open highways, where prices zoom by fast.
VWAP, or Volume-Weighted Average Price, is a bit like the market's GPS. It calculates the average price based on trading volume, helping traders stay on the right path. It’s a rolling measure of the market's mood, showing you if you’re in tune with the trend or heading off course.
Together, these tools are like your market toolbox. They highlight where breakouts are likely to happen and whether those moves are solid or just false alarms. It’s all about reading the signs and not getting lost in the noise!
Using Volume Profile and VWAP can make navigating the wild world of breakouts feel less like a roller coaster and more like a guided tour—complete with maps and checkpoints. Dive in, and you might just find the treasure you’re looking for!
In contrast, Volume Profile and VWAP provide two different views of market activity. These tools help a trader better see what is happening in the market that leads to price changes.
Volume Profile delves into the trading history by showing how much volume has occurred at different price levels. It reveals where traders have been most active, marking those crucial High-Volume Nodes (HVNs) where the market tends to slow down. These zones often become support or resistance because they reflect areas of intense interest by buyers or sellers. Low-Volume Nodes, on the other hand, indicate prices where there is minimal interest; points the market rushes through, hence fast price movements.
VWAP gives a running average of price movements, weighted by the volume of trades. It is somewhat like tracking the heartbeat of the market. By comparing current prices with VWAP, traders can sense if the market is bullish or bearish. Prices above VWAP suggest buying strength, and those below seem to be reflecting selling pressure. It's very handy in the determination of the fair value, as well as in confirming breakouts, and even helping find areas of support and resistance as conditions change in dynamic markets.
Together, these two provide a dual advantage. Volume Profile gives a broad historical view of the key price levels, while VWAP serves as an indicator for the real-time pulse of the market-accuracy in decision-making with both the past and current data serving as guidance for a trader on where the action's headed and responding with confidence.
Volume Profile and VWAP are essential tools for spotting potential breakouts, providing a roadmap for traders to follow when markets are about to make big moves.
Volume Profile helps identify critical price zones where a breakout is likely to occur. High-Volume Nodes (HVNs) are areas of heavy trading where price tends to stall. When a price breaks through these zones, it's a strong signal that the market may be gearing up for a significant move. On the other hand, Low-Volume Nodes (LVNs) are like speedways—prices can move quickly through these levels due to low trading interest, making them prime zones to watch for potential breakout opportunities.
VWAP acts as a dynamic guide for measuring market sentiment during a breakout. It provides a constantly updated average price, weighted by volume, which can help confirm if a breakout is genuine. If the price breaks above VWAP and stays above it, it suggests a bullish breakout with solid buying interest. Conversely, if the price falls below VWAP during a breakdown, it hints at strong selling pressure. VWAP’s role in identifying fair value allows traders to gauge whether the breakout is a momentary blip or a sustained shift.
When combined, these tools create a clearer picture of breakout scenarios. Volume Profile highlights key levels where breakouts might start, while VWAP confirms the strength and validity of the move. This combination allows traders to spot breakouts early, manage risks, and act with greater confidence.
Question 2: Identifying Breakout Zones with Volume Profile |
|---|
Volume Profile is such a goldmine for traders, especially when trying to study breakout zones. For example, in the trading of Steem/USDT, one cannot really miss the manner by which the price acts with historical trading volumes. Breakouts are an essential signal of sharp price moves as they break support or resistance. Identifying high and low-volume areas provides insight into knowing when such breakout moments are possible so that traders may get ahead of the game.
We will analyze three different timescales: the daily, weekly, and 4-hour chart. Every view provides the market in a unique way, showing where significant trading activity was concentrated and where it was very sparse. High-Volume Nodes (HVNs) indicate which areas of support and resistance are strong, and Low-Volume Nodes (LVNs) show the places where price can move the fastest. The data from these charts will reveal opportunities that traders were not aware of and is therefore a game-changer in strategy formulation.
Now, let's dig in deep into each chart to uncover the key breakout zones of Steem/USDT.
 Daily time frame Daily time frame |
|---|
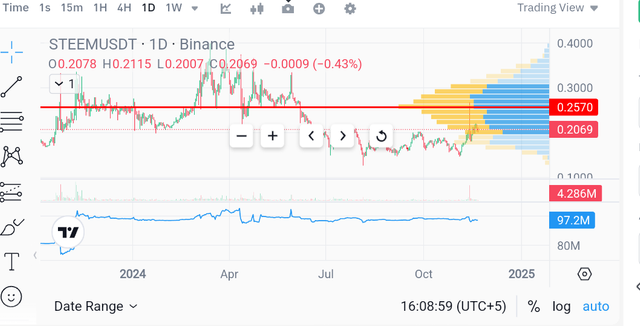
For breakout traders, the daily chart still remains one of the most essential perspectives. The high-volume zone between $0.26 and $0.27 represents a very strong resistance area where price has been rejected several times.
This congestion area is important because it represents the area where most trading activity has occurred. What this indicates is that most traders are watching closely for this level. Therefore, the current price sitting at $0.2069 means that the market is gathering momentum.
A break above $0.2570 could trigger a buying stampede, given the minimal resistance remaining—an old favorite "breakout territory." Traders should be ready to pounce when this resistance is challenged.
 Weekly Chart for Long-Term Outlook Weekly Chart for Long-Term Outlook |
|---|
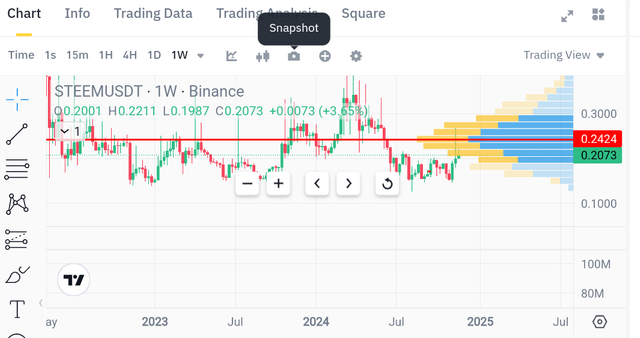
The weekly chart puts Steem's moves into context. The $0.24 - $0.25 zone remains as a level of longer-term resistance; breaking above that should signal a shift in sentiment.
With lower volumes at higher levels, any surge beyond $0.2424 might indicate a restart of a new bullish trend. This makes the weekly chart very attractive to swing traders targeting higher prices.
A weekly closing above $0.25 might attract more institutional flows. In that case, the price might shoot up further.
 4-Hour Chart for Short-Term Trades 4-Hour Chart for Short-Term Trades |
|---|
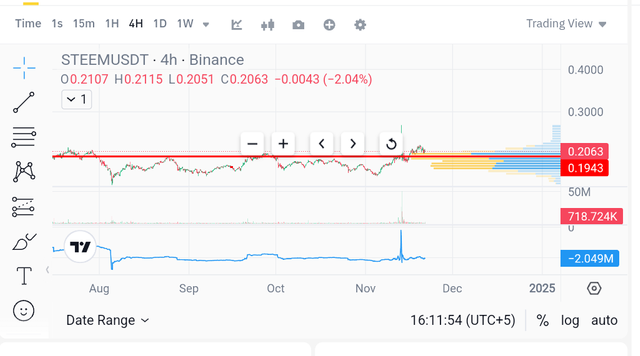
In the eyes of short-term traders, however, the 4-hour chart is a real-time pulse of the market. In particular, the level of $0.21 is crucial, as seen in how the price is roughly hovering around $0.2063.
This type of chart information is especially useful for day traders seeking to capture smaller but significant movements. The low-volume nodes (LVNs) between $0.19 - $0.20 are the most interesting-they are price zones likely to break quickly in any direction if violated.
A downward break below $0.20 might generate fast declines, whereas an upside break toward $0.26 could produce a swift increase.
Psychological Levels and Market Sentiment
Now remember that some price levels represent psychological barriers. For instance, $0.20 is not just a technical level but a round number that could influence trader sentiment. If price holds above $0.20, it signals market strength, while dipping below might induce a wave of selling pressure. The significance of Volume Profile is that it visualizes where these psychological price walls align with actual trading data, making it easier to gauge when sentiment is about to shift.
Strategy: Timeframes Mix
In combination with all three timeframes, an effective strategy can be followed. Assume that the daily chart is showing a potential breakout above $0.2570. The 4-hour chart, on the other hand, seems to confirm a serious push past $0.21. This will give a higher-confident signal to enter a trade. Similarly, if the weekly chart can also support a move above $0.25, the trader might want to hold the position for a bigger gain. Multiple perspectives reduce the risk of false signals and increase the chances of catching a successful breakout.
Managing Risks with Volume Profile
Despite the power of the Volume Profile, it is not infallible. There are always chances of false breakouts where the price may momentarily penetrate a level only to revert back shortly. For that, there is always room to place tighter stop-losses just below key support levels such as $0.19, or trail stops as the price moves above those critical zones. Moreover, one could use VWAP as a dynamic indicator to validate whether a breakout is true or not, just a fake-out. If the price stays above the VWAP during a breakout, it is confirmation that the momentum is strong.
Volume Profile in Practice
Volume Profile is like the market's "heartbeat". The high-volume areas are places with heavy traffic: prices make few jumps because there is much interest and action. In contrast, low-volume zones are empty highways where prices can zip past swiftly. This makes understanding Volume Profile crucial for any trader who wants to make gains from fast-moving markets. When you see an HVN, it shows that there is a crowd of buying and selling going on, whereas an LVN indicates open space—ideal for those eager to catch a fast-moving trend.
Question 3: Validating Breakouts with VWAP |
|---|
VWAP, or Volume Weighted Average Price, is kind of like the market detective—dug deep in the relationship between price and volume to see if a breakout is really true. It's a way that by watching the behavior around the VWAP line, traders get clues about the actual strength in the breakout. It's a way to check if the price is only a flashy move or if it's just ready to break free.
When the price breaks above VWAP and remains above, that's a good sign that the bulls are in charge and pushing it higher with real strength. The more especially so when volume is supporting the move: like when the crowd of people cheering grows louder as the price does, it's not just a matter of crossing the line; the price has to demonstrate it's happy being above, and this is when traders start to believe in the breakout.
This time, if the price goes below the VWAP, it makes you believe that bears are growing strong and are pulling the market down with their own weight. At this point, VWAP acts like a ceiling which prevents the price from climbing up. And if you see the price struggling around VWAP, then it's a clue that the breakout might not be as strong as you see it-distracted athlete trying to clear a hurdle, he keeps going, and he hasn't crossed the bar yet.
The traders use VWAP as a "trust meter" for breakouts. If the price remains well above VWAP with good volume, they will have more trust in this breakout and go long. In case the price is hugging around the VWAP line or retreating rapidly after a breakout attempt, it's a sort of a warning signal: better to be careful or wait for an even clearer one. It's all about knowing who really calls the shots: the bulls or the bears.
VWAP also works to pinpoint the fakeouts. If a price briefly breaks through VWAP and then rebounds, it serves as a classic sign of a false breakout. Smart traders pay great attention to such moves, often waiting for confirmation over several periods before committing. If the price holds above VWAP for a larger duration, that's a green light, indicating that the breakout has real momentum.
Another cool trick is to overlay multiple VWAP lines for multiple time frames, whether it's daily, weekly, or monthly. This gives a multi-dimensional view of how strong the breakout is over time, like viewing a storm developing from various angles. So if the price is above several VWAPs lines, then it makes the breakout look even stronger, like getting the report from multiple weather experts.
Imagine the VWAP line in bright blue, winding its way across the chart like a river, with price candles in green and red showing the market’s dance around it. The volume bars below are color-coded: green for rising, red for falling, indicating the market’s rhythm. While still making that move, you can then watch the drama unfolding: will it settle confidently above the blue VWAP line, or hover uncertain of its next move? That's the kind of tension that makes the market exciting!
 Price/VWAP Price/VWAP |
|---|
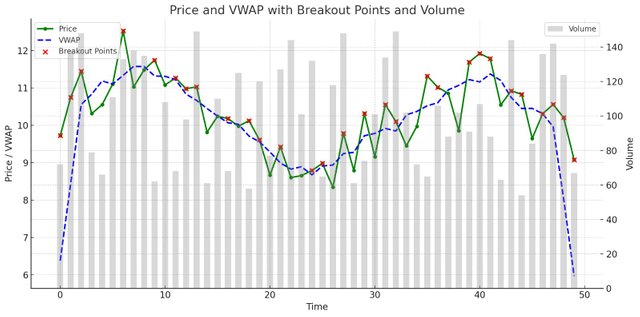
Here is a chart depicting the relationship between Price, VWAP, and Volume, with breakout points highlighted:
- Green Line with Dots: Represents the Price over time.
- Blue Dashed Line: It is the VWAP or (Volume-Weighted Average Price), a tool to measure price movements.
- Red Crosses: These mark Breakout Points where the price crosses above VWAP as a possible indication of strength in the breakout.
- Gray Bars: Signify Volume, which serves to support the importance of the price movements.
The visual difference between price and VWAP, combined with the breakout indicators, allows it to be a little easier to comprehend how VWAP can serve to confirm breakout strength in trading.
In the bull run of Steem, here is a fascinating price-action behavior that surfaced from its interaction with the VWAP line.
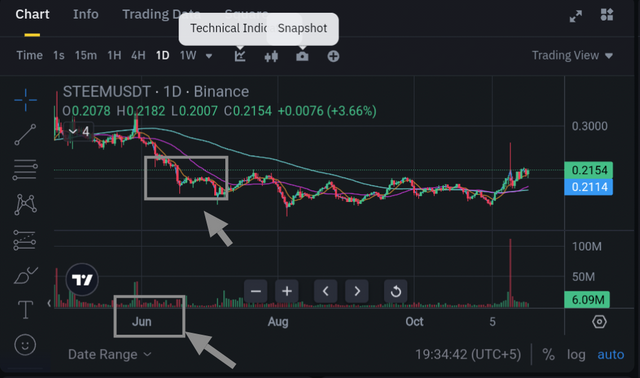 Steem/USDT price movement in June Steem/USDT price movement in June |
|---|
During June, the price of Steem/USDT had been ranging approximately about $0.20 to $0.21, as it was simply touching the VWAP line and this was becoming a consolidation area in which the market was still unsure of what to do. The VWAP stands for volume-weighted average price, and the price is staying near the VWAP line, showing a balance between buyers and sellers.
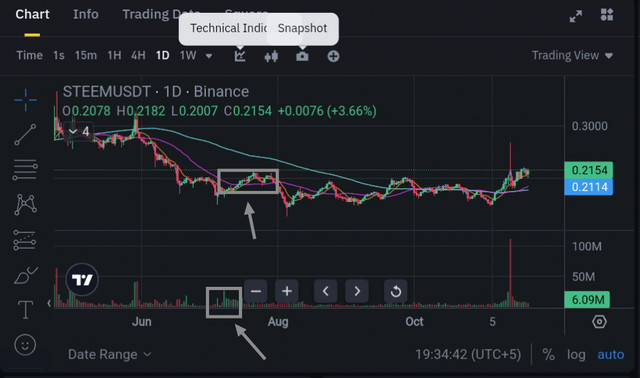 Steem/USDT price movement in July Steem/USDT price movement in July |
|---|
Around the middle of July, the price started testing VWAP more aggressively. The price oscillated between $0.20 and $0.22, looking to break out. Every time the price came into contact with VWAP and bounced back, it gave the implications of building a strong upward thrust. Traders like to trade on such behaviors as foreshadowing that the price will take off if it decisively breaks away from VWAP.
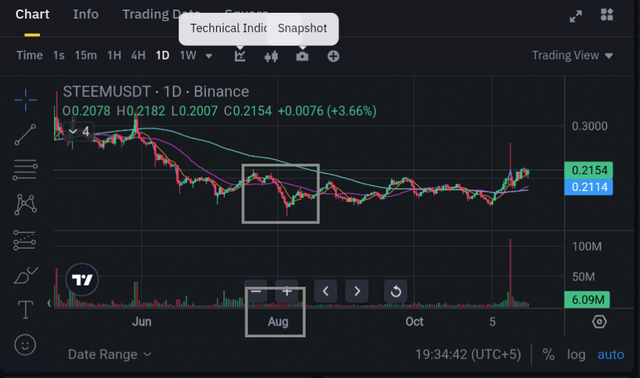 Steem/USDT price movement in August Steem/USDT price movement in August |
|---|
The price action of Steem really became interesting as it moved into August. The market showcased several instances of prices climbing above the VWAP and reaching nearly $0.23 before falling in again. The pullbacks often landed right on VWAP, making it a dynamic support level. Price bounces off VWAP are indications that the buying strength persists, besides hints of accumulation before such a larger move can be made.
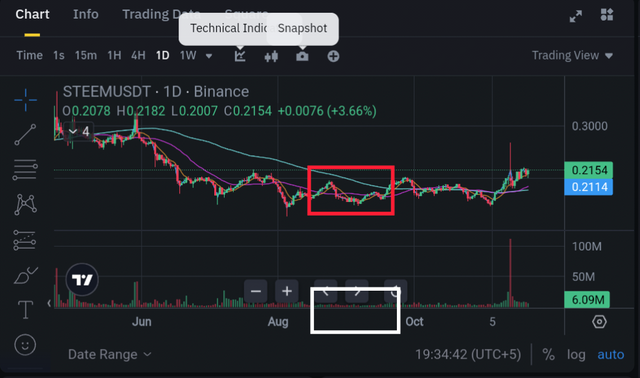 Steem/USDT price movement in September Steem/USDT price movement in September |
|---|
Things change in September. Here, the Steem/USDT pair breaks out with more conviction above the VWAP line at $0.24 to $0.25. This makes bullishness more apparent. The price breaking above VWAP indicated strong buy pressure and VWAP played its role as a support every time the price slightly dipped, allowing the traders to be more confident of a sustained bull run.
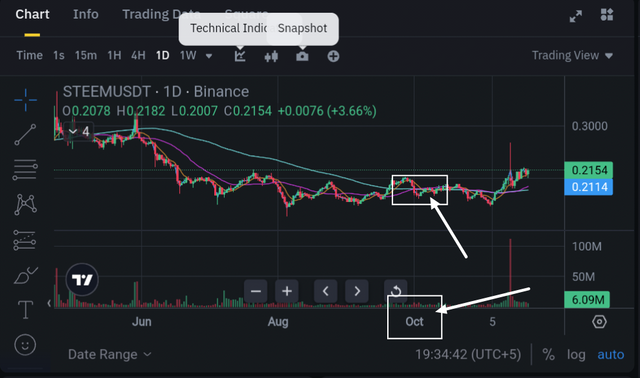 Steem/USDT price movement in October Steem/USDT price movement in October |
|---|
By early October, breakout was evident. Steem/USDT quickly broke above $0.26, showing the breakout wherein the price finally broke out of the consolidation phase around VWAP observed earlier. It indicated a steep move above the VWAP and showed a breakout wherein the price started moving upwards towards $0.30, which reflected the momentum traders were waiting for. This breakout confirmed the trend as bullish and proved VWAP to be an excellent support area during the run.
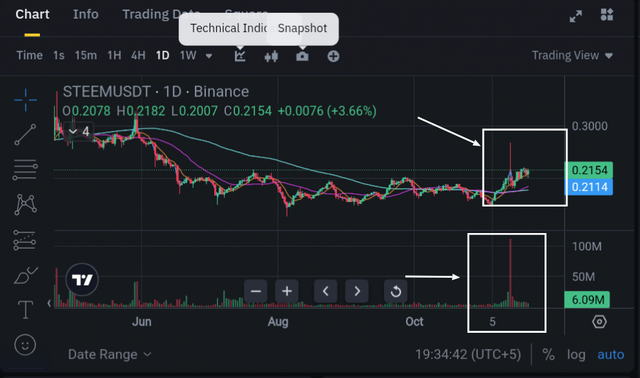 Steem/USDT price movement in middle of october Steem/USDT price movement in middle of october |
|---|
The biggest price reaction was in the middle of October, when Steem's price reached about $0.68, well above the VWAP. That spikiness, coupled with increasing trading volume, showed that the breakout was strong.
During the entire rally, the VWAP served as a trailing support level; each and every bounce reinforced the upward momentum. The in-and-out action of Steem's price with the VWAP in the bull run demonstrated how traders can make use of the VWAP to affirm breakouts, measure market sentiments.
Question 4: Developing a Breakout Strategy |
|---|
Using both Volume Profile and VWAP can offer clearer guidance when developing a strong breakout strategy for the Steem/USDT pair.
The breakout strategy focuses on locating potential breakout opportunities, setting specific entry points, protective stop-losses, and strategic profit targets.
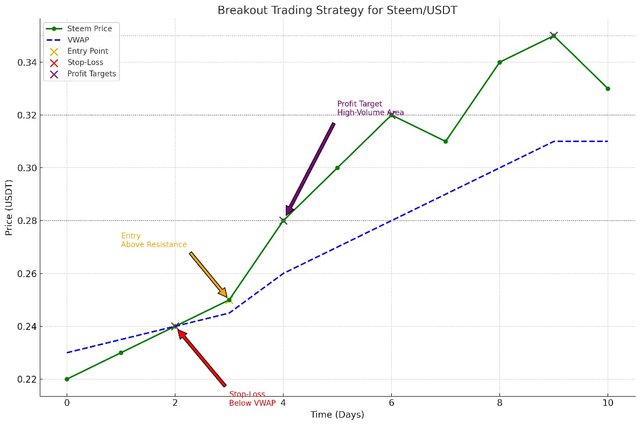 Breakout trading strategy for Steem/USDT Pair Breakout trading strategy for Steem/USDT Pair |
|---|
Step 1: Analyzing the Market with Volume Profile
Start by observing the Volume Profile to find out some significant levels of support and resistance. The nodes with high volumes are the areas where much trading has occurred and which show strong support or resistance. When it approaches $0.21 for the Steem price as its resistance level, it is very important to keep an eye out for a probable breakout. A sudden increase in volume around that price range could indicate the market wants to continue pushing upward.
Step 2: Monitoring VWAP for Confirmation
VWAP is a form of trend confirmation. On breakout, if the price can be observed remaining above the VWAP line, then strong buying pressure exists. For Steem, if it can hold above the VWAP at the price of $0.22, then that can be considered as a good sign that the break would have strength.
Step 3: Defining the Entry Point
Once a breakout above a key resistance is confirmed with a solid close above VWAP, enter the trade. For example, if Steem breaks past a resistance level at $0.23 and the price stabilizes above this zone, place your entry slightly above, for example, at $0.235. This reduces the likelihood of entering a false breakout.
Step 4: Setting a Stop-Loss
To guard against unexpected reversals, a stop-loss can be placed below an important support level or under the VWAP. In this situation, assuming Steem has develop over here shows momentum above $0.24, a stop-loss right underneath the VWAP at around $0.22 will make for a clean exit in case the strength of the move begins to subside. That way, the losses remain tight if the breakout doesn't hold.
Step 5: Setting Profit Targets
The profit targets must be associated with Volume Profile data. Low-volume areas or previous price peaks could be good first targets. So, if the Volume Profile shows a low-volume zone around $0.28, this becomes an ideal first target. Then, aiming at a second target at $0.30 from this level would depend on market momentum and how the price reacts as it climbs.
Entering trades with confidence, managing risk, and optimizing profit taking are made possible by using Volume Profile to detect market interest and VWAP to gauge how strong the trend is. In this strategy, every step is aimed to balance risk with potential rewards; therefore, this strategy is best for breakout opportunities in the Steem/USDT market.
Question 5: Avoiding False Breakouts |
|---|
Breakout trading is an exciting strategy, but it has some inbuilt risks, one of the biggest being false breaks. False break occurs when the price will, temporarily, break a certain support or resistance point, then pull back and squeeze the unsuspecting trader, resulting in fast losses if left uncontrolled. Tools like Volume Profile and VWAP can help minimize these risks and hence add more reliability to your breakout trades.
Understanding False Breakouts
False breakouts take place when the price breaks above resistance or below support but the move lacks volume or momentum to hold it. For instance, if Steem/USDT can briefly break above $0.25 but rapidly fall back below $0.23, that is a strong signal that buyers haven't been able to drive the price up. These types of situations can be tough, but Volume Profile and VWAP can be very useful tools in navigating them.
Using Volume Profile to Identify Real Breakouts
The Volume Profile is very useful in determining the high and low volume trading areas. The presence of a real breakout must always be confirmed with the occurrence of increased volume at the entrance of trading in some key levels. If the Steem price is testing a resistance at $0.27 with high volume above it, then the real interest behind the breakout is more likely to be successful. Low-volume areas may hint that the market does not support the area, which elevates the risk of a false breakout.
Using VWAP for Added Confirmation
The VWAP actually gives insight into the average price using trading volume and can be a safety check. If a breakout move in Steem/USDT is holding above VWAP following a price surge—in which the price climbs to $0.28 and holds above the VWAP—it suggests that buyers are supporting the higher levels. Holding below VWAP after a breakout might actually represent the weakness, signaling a potential false breakout.
Practical Tips to Increase Breakout Reliability
Wait for a Confirmation Candle: Entering a trade immediately at breakout might be very dangerous. A confirmed break requires closing above the resistance level or below support level. For example, this would be a confirmation of strength by closing above $0.30 with a stable candle.
Volume as a Guide: High volumes often mark the instances of a breakout confirmation. When Steem surges above a major resistance in combination with volume, it is a good sign. Low volume should be seen as a warning signal.
Align with Trending Market: Use VWAP to align trading with the trend of the market. A rising VWAP with an above VWAP breakout attempts after being under it that means a strong trend is happening, and if Steem fails to hold above a falling VWAP, a caution should be issued.
Hedge Stop-Losses Dynamically: Set the stop-loss orders below the recent support or even VWAP. In case of breaking upwards to $0.29 but unable to remain above, a stop-loss just below $0.28 can add to limit if that breakout fails.
Look for Retests: A good breakout often tests the former resistance as support prior to breaking higher. For example, if Steem breaks $0.32, and then goes back to $0.30 to confirm it as a level of support, this is a stronger signal.
The addition of volume profile and VWAP analysis creates a bigger picture of the market. This two-pronged approach filters false breakouts and provides a clearer picture in regard to true market interest and strength.
kind Regards
@artist1111

Adieu, folks!
May the winds of fortune
carry you to greatness!
May the winds of fortune
carry you to greatness!