BASIC TASK IN ARC GIS (SERIES 1) – How to Georeference a map using Arc GIS
BASIC TASK IN ARC GIS
- (SERIES 1) – How to Georeference a map using Arc GIS
INTRODUCTION
Before the advent of GIS cartography has been in existence for so many years, I guess some of us where not born when map making came to play, the end process of cartography is called A MAP GIS stands for (geographical information system)
 HAND MAP.
(License: Public Domain]: Pixabay
HAND MAP.
(License: Public Domain]: Pixabay There are two types of DATA in GIS such as:
• Vector Data
• Raster Data
Vector Data
Vector data is the representation of geography in point, line, and polygon (which can be seen as Area Raster). Polygon depicts areas features such as boundaries lines of an Area, lake boundaries, state boundaries, buildings. Polygon features usually comes in two dimensional forms. Lines usually comes inform of line features such as River, Roads, footpaths, Pipelines etc. Point are usually used to depict nonadjacent features, it can be used to represent a state capital on a map, point location, benchmarks, transformers, telecommunication mast
Raster data
Raster data usually are inform of grids, we have two types of raster continuous and discrete. Example of continuous raster are temperature and elevation measurement and for discrete we have population density. In every images there are cells the smallest unit of an image is called a pixel so each cell has a pixel value ranging from 0-255.
- here is a little observation
move very close to your system, when you look at it carefully you would discover some tiny boxes on your system screen those boxes have pixel sizes which forms up the whole screen. behind every pixel value there is a DN(Digital Numbers)
pixel values ranges from 0-255, so most raster images usually comes inform of cell matrices
Method of Data collection in GIS
• Primary Data collection &
• Secondary Data collection
Primary data
Primary data basically is a data which one collects directly from the field or recent images from a satellite imagery. Data can be collected through hand held GPS (Global Positioning System).
Secondary Data
Secondary Data is a method of data collection which is collected from existing source, such as maps, charts, documents. Although the Data I will be using to show you guys this practical is a secondary Data. one of the disadvantages of secondary data is that sometimes you don't have a choice you just have to use it like that when you couldn't get a primary data.
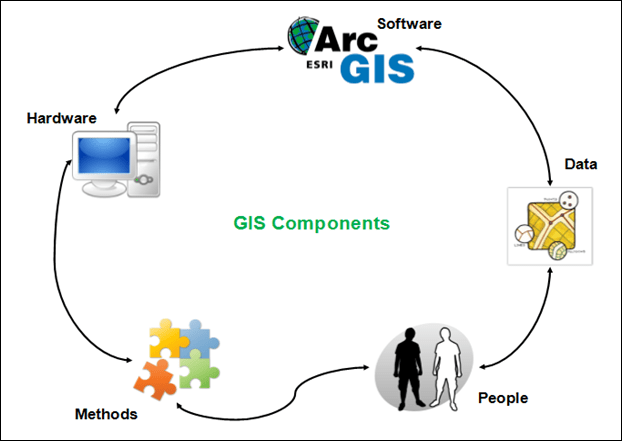 Component of GIS
(License: google]: grindgis.com
Component of GIS
(License: google]: grindgis.com 5 components of GIS
Software
the software is like a tool which is used in the mapping process. key software components are OSsoftware, network software, GIS software.
Method
The methods are more like the standards or guidelines which are used in the map making process of GIS.
People
People are the personnel’s who use this tool, the people are me, you, GIS technicians. GIS is a tool for all irrespective of your profession.
Hardware
Hardware deals basically with the physical part of a computer which can help you achieve your aim in your Arc GIS.
Data
Data is one of the most important component of GIS without data it’s impossible to carryout spatial analysis with your ARC GIS.
Characteristics of data, data can be manipulated, it can be retrieved, it can be arranged, it can be stored, it can be integrated, it can be processed, it can be distributed etc.
HERE IS THE DATA WE WOULD BE USING TODAY ON THIS SERIES
• This is a map of Nigeria showing all the states and capital, Nigeria is a Country in westAfrica, popularly known as the Giant of Africa this data is a secondary data it was a data I got from my lecturer in school.
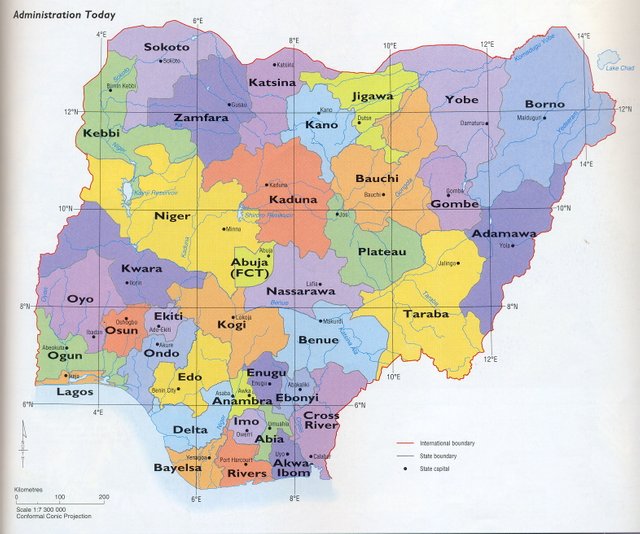
NIGERIAN MAP
- Before we go into the main business let me give a brief history of GIS how it came about.
HOW GIS CAME ABOUT
GIS came about due to advancement in technology, computer mapping, programming, mathematics etc. but computer science really have a great impact on GIS. GIS all started in 1854 when there was an outbreak of cholera in the great city of London, a popular physician by the name Dr. John Snow took it upon himself as a problem which was needed to be solved so as to reduce the mortality rate in the city. Many people were thinking the disease was through the air, john snow used maps to prove how cholera in the city resulted through a water pump which was more like one of the major pump supplying water to the community. However, this map shows how cholera was being spread through water in the city of London, john snow made maps showing the outbreak location (where this incident was centered upon), property boundaries and water lines. When he finished adding all these spatial features to a map, that was where he discovered that CHOLERA was the major cause of death in the city. However, John Snow was able to connect geography and human health with the help of his Cholera map, This was the beginning of geo-spatial analysis. with the solution in which John Snows map proffered it is a Sign that GIS is a Problem Solving tool, GIS helps in decision making.
HOW TO GEOREFERENCE A MAP
• Using Nigeria Map as a secondary data, this was the only Data i could lay my hands on.
STAGE 1
• Before I start here is a link on how you can download Arc GIS
How to download arc GIS
• How to install GIS
How to install arc GIS
WHAT IS GEO-REFERENCING
Before I go further to the step of showing you how to goereference a map I will like to explain what geo-referencing means. Georeferencing is the process of analyzing or taking a geographical image, Aerial photo, cadastral map, topographical map taking it to GIS for GIS to actually place it in the right position with the real world location.
georeferencing
STEP 1
NOTE
Anywhere you see a Red ring circle or box on any icon which I indicated on the images below, pay attention to it because that’s the step process I’m going to explain as we go further and you would need a good Mouse so as to enjoy the process and be able to gain one or two things as we proceed.
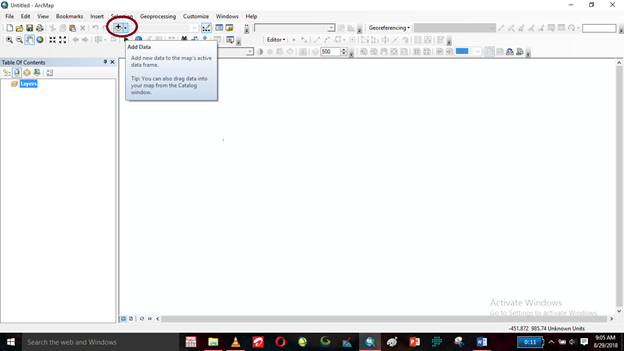
• Launch your Arc Gis
• After launching it, it will appear as the image below show an empty space on your work environment.
• Click on the add data as signified on the image.
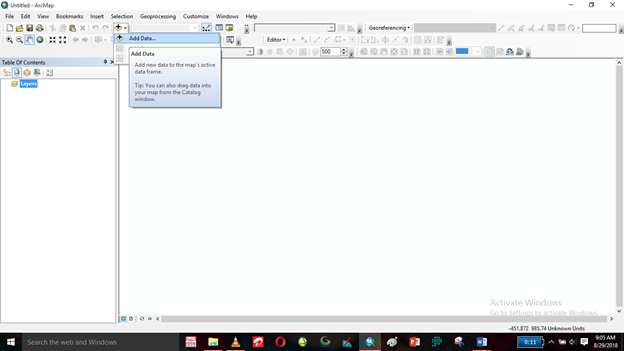
STEP 2
• Click on add data
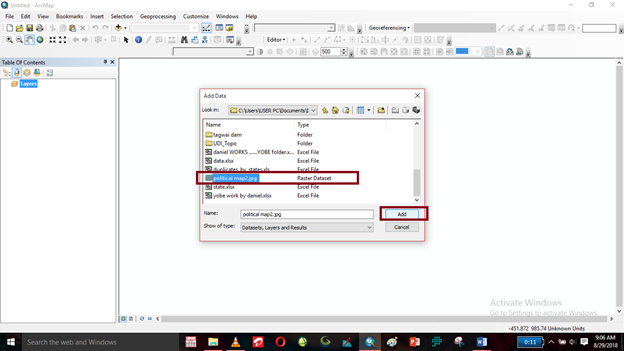
STEP 3
• After click on add data
• It will take you to where you can locate where you saved your data
• Click on the data and click on Add
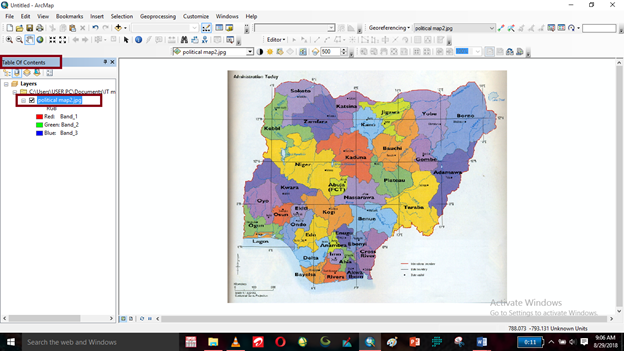
STEP 4
• After adding your data it will display on your work environment
• Take a look at your table of content you would see that the Data is added there with the name (political map2).
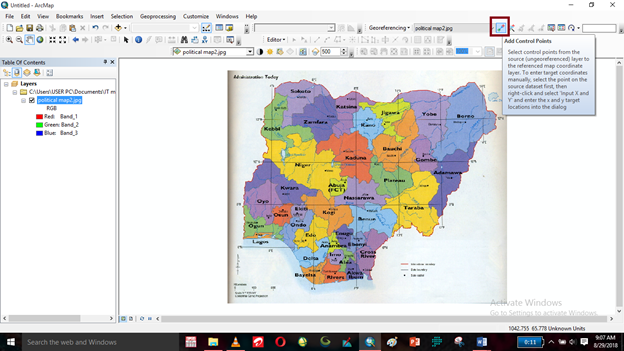
STEP 5
• After adding your data
• The next stage is to click on the add control point as shown on the image below
• Ones you click on it, it will change inform of a plus sign (+)
• That is what you would use in georeferencing the map
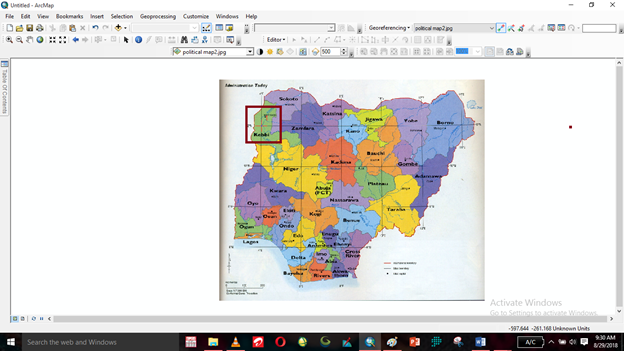
• If you look closely on the map you would noticed some boxlike lines, those lines are called the GRID lines. This grids are more like scaling the map using coordinate points so as to help in possible cases of georeferencing.
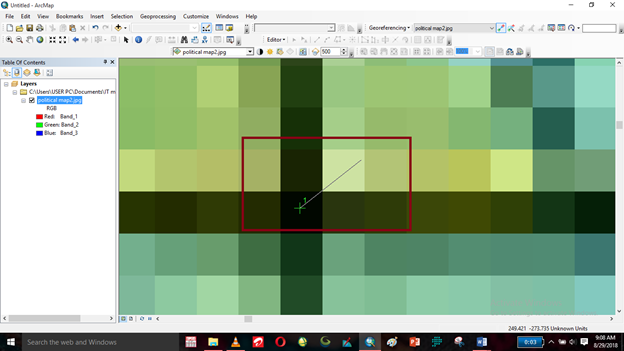
STEP 6
• After it has changed into the plus sign + zoom in to the point where those lines intersect
• You can pick from any point where line intersect but take note of the figures at the top and at the side of the map. Eg. The longitude and latitude 4֠E 12N because that is what you would input in your add control point
• But before you go further try and pick out the point where you want to georeference eg.
Although this are the points we would be using though.
Point 1 (4E, 12N)
Point 2 (12E, 12N)
point 3 (12E, 8N)
point 4 (4E 8N)
• After doing all this try and locate the points where all this coordinates intersects
POINT 1
• After locating the intersection point click the middle point move your mouse to any direction either right or left.
• Click at the point of intersection move it right or left.
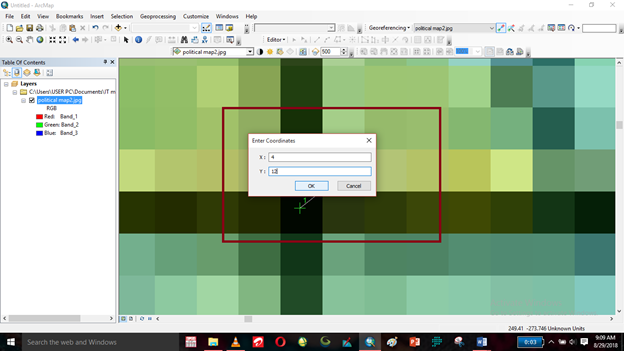
• Right click.
• On the X & Y
• Y is the latitude and X is the longitude
• Input the coordinate eg. 4E, 12N
X = 4
Y = 12
• After inputting the coordinates click on ok.
NOTE
• If you experience anything like the image below click on the red circle indicating Full Extent full extent is the Globe inside the circle as shown below.
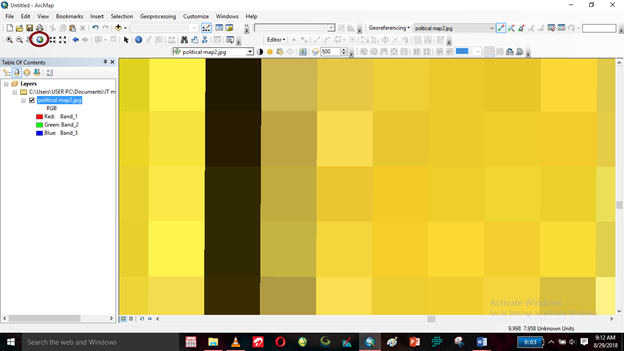
FULL EXTENT
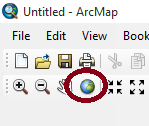
• After clicking on the Globe “Full Extent”
• It will zoom back to the full map
• Always make use of the full extent whenever you add control point and then it zooms in like this click on the Globe “Full Extent”
Step 8
- NOTE
the procedure for POINT 1 would be applicable to POINT 2, ignore if I use the image from the first inputtation of point 1 so please don't get confused.
POINT 2
• Zoom in to the point of intersection you want to use for your
point 2
• Add control enter the coordinates points
• So this time the coordinate whould be
X = 12
y = 12
• After inputting the coordinates
• Click okay
• If it zooms in
• Click on Globe “Full Extent” It will go back to normal
• Please ignore the x=4 and y= 12 because it is the coordinate point for point 1.its not meant to be used from pont 1.
NOTE
There are times when if you input the coordinates wrongly the map would TILT or change position this is an error on your path, but the great new is that there is a possible solution to rectify this. In order to rectify this you have to click the VIEWLINK TABLE it is an icon at the georeferencing tool as represented in the image below circled with the red ring.
Image 1
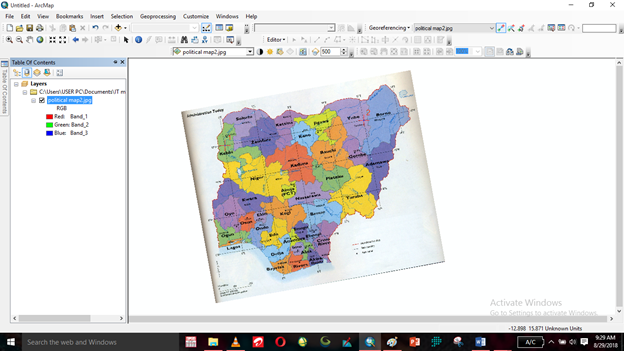
Image 3
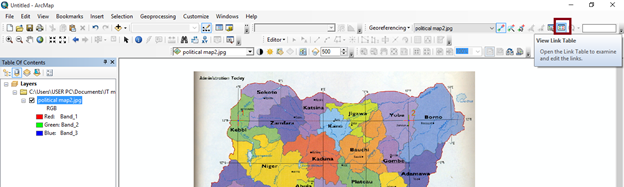
IMAGE 4
• After clicking on the view link you would see all the points you have inputted, so locate the last point in it
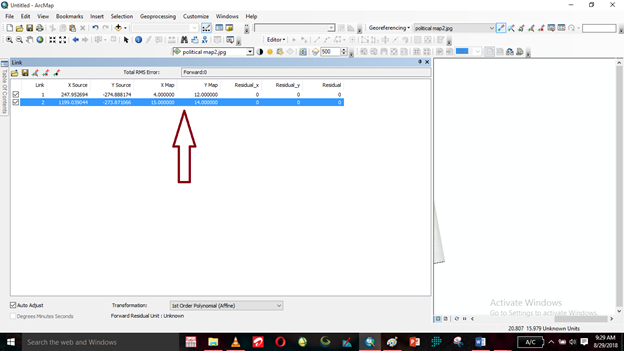
• After highlighting the link you made a mistake on, press delete on your keyboard to erase it and it will go back to its original form
• Next thing to do is to input the coordinates correctly in order to avoid the image from TILTING
This is just an indication if you encountered any difficulty while trying to add controls to your points while goereferencing.
This is how the image would look like after deleting the points on your view link table, like the image above shows that the second point has been deleted.
• To continue input the coordinate the other way so as to get the map goereferenced
• X & Y to add control points
STEP 9
Point 3
• Zoom into the point of intersection for your point 3
• Move to the right or left
• Then right click and input your values for the 3rd point eg. (12E, 8N)
• However it will reach a point that when you click on add control point you would see that the coordinate point would be having decimals i.e, the coordinate would look I this format.
Eg 7.56 and 12
From this point you would notice that the map is aligning itself with the location of the Earth and on the map it is showing 8 and 12 that means you are on track
STEP 10
Point 4
• Point 4 is not different from point 1, point 2, point 3 it is still the same procedure
• After adding your points on you object
• Move left or right at the point of intersection where you want to georeference
• Input the figures.
• Click on ok
STEP 11
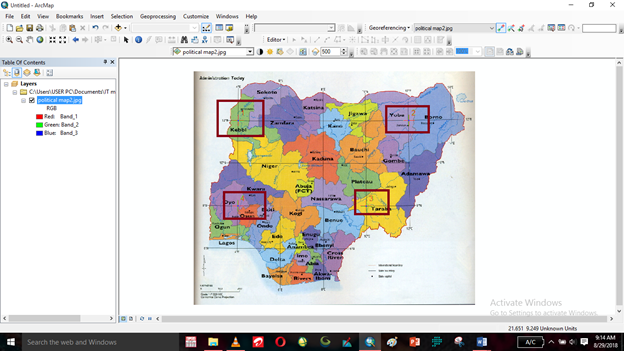
• After you have finished picking all your points
• The map would look in this way on the image below
• To erase those point 1,2,3,&4
• Go to your georeferencing
• Click the drop down arrow
• And click on UPDATE GEOREFERENCING
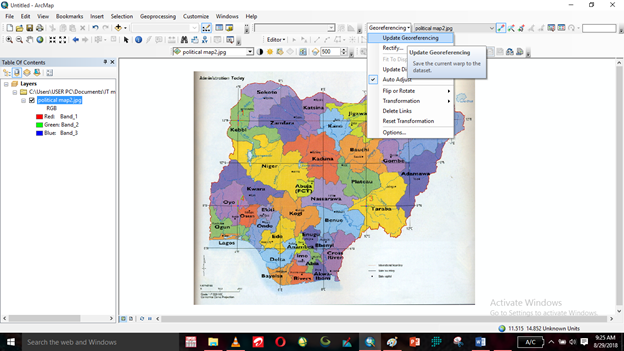
Ones you update georeferencing it will clear all the points on the map eg point1, 2, 3 & 4 leaving the map properly georeferenced like this, the essence of update georeferencing is to make the map georeferenced for further use anyone can make use of it without going through the stress of georeferencing again.
SUMMARY
GIS is a very good software which helps so much in conducting several analysis, take for instace the john snow's map how he was able to save a community from further spread of cholera so you see GIS can't be applied only to Geography, Geology and Surveying alone it can be applied to various fields even in marriage, football one can apply GIS i hope this little tutorials would help stay tuned on my next series.
HOW TO DIGITIZE A MAP
Follow my Blog @guchidan
UPVOTE and RESTEEM if you like what you saw thank you all.
……..Thanks for stopping by…….
NOTE
All Images showing those maps where screen shots from my system just to explain the whole process i didn't copy it from anywhere.
REFERENCES
• How to install arc GIS
• Brief history on GIS
Primary and secondary data
• georeferencing
• vector and Raster data
• How to download arc GIS
Free Resteem , Follow and Vote For Everyone Click Here
Just Follow The Rules 😇 Thank You!